Sundial

Charts section#199 of 250Web

About this design

Charts section for Web: workspace usage report for Sundial, an AI drafting and content generation tool.

  • Style: light mode, pale off-white canvas, subtle grey rules, deep teal accent.

  • Layout: settings sidebar, three summary stats above a tall bar chart, member table beneath with pagination.

  • Components: team scope segmented control, day range chips, gridded bar chart, per-member table with avatars, search field.

  • Vibe: clean, restrained, practical — AI productivity SaaS.

More Charts sections

View all 250
Charts
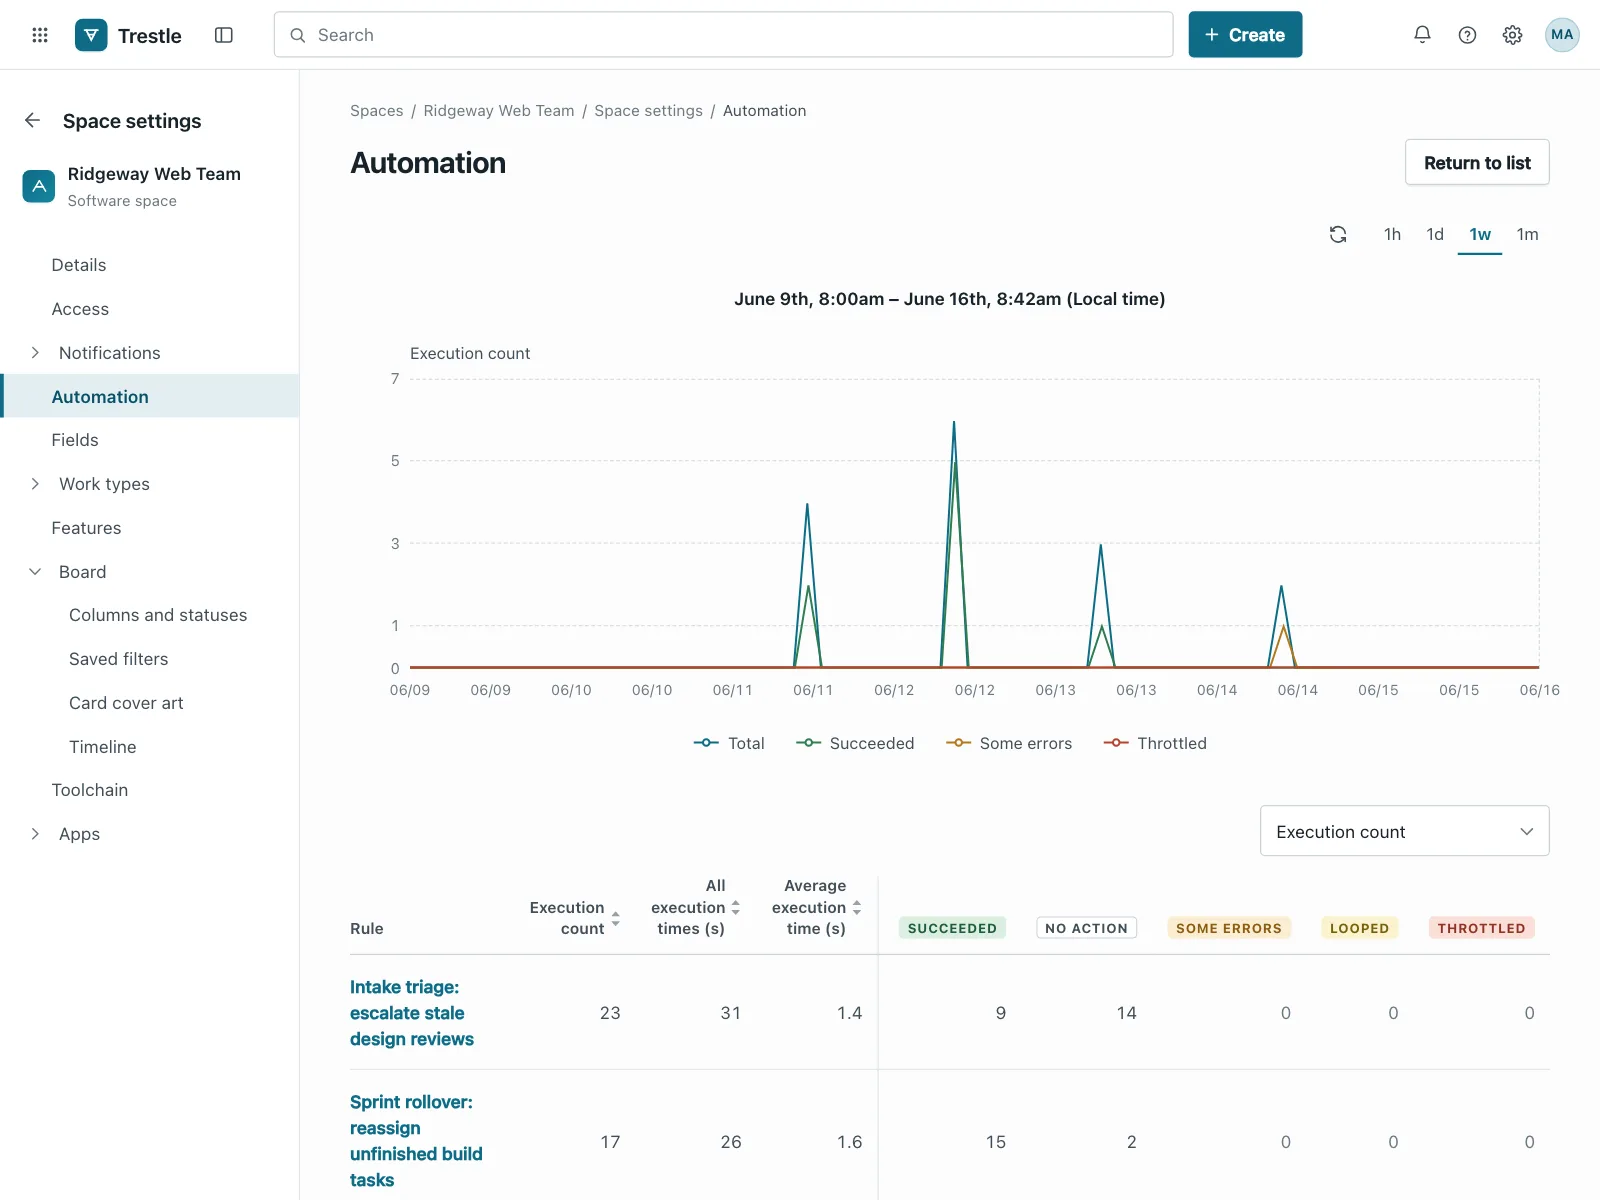
Charts | Trestle
Charts
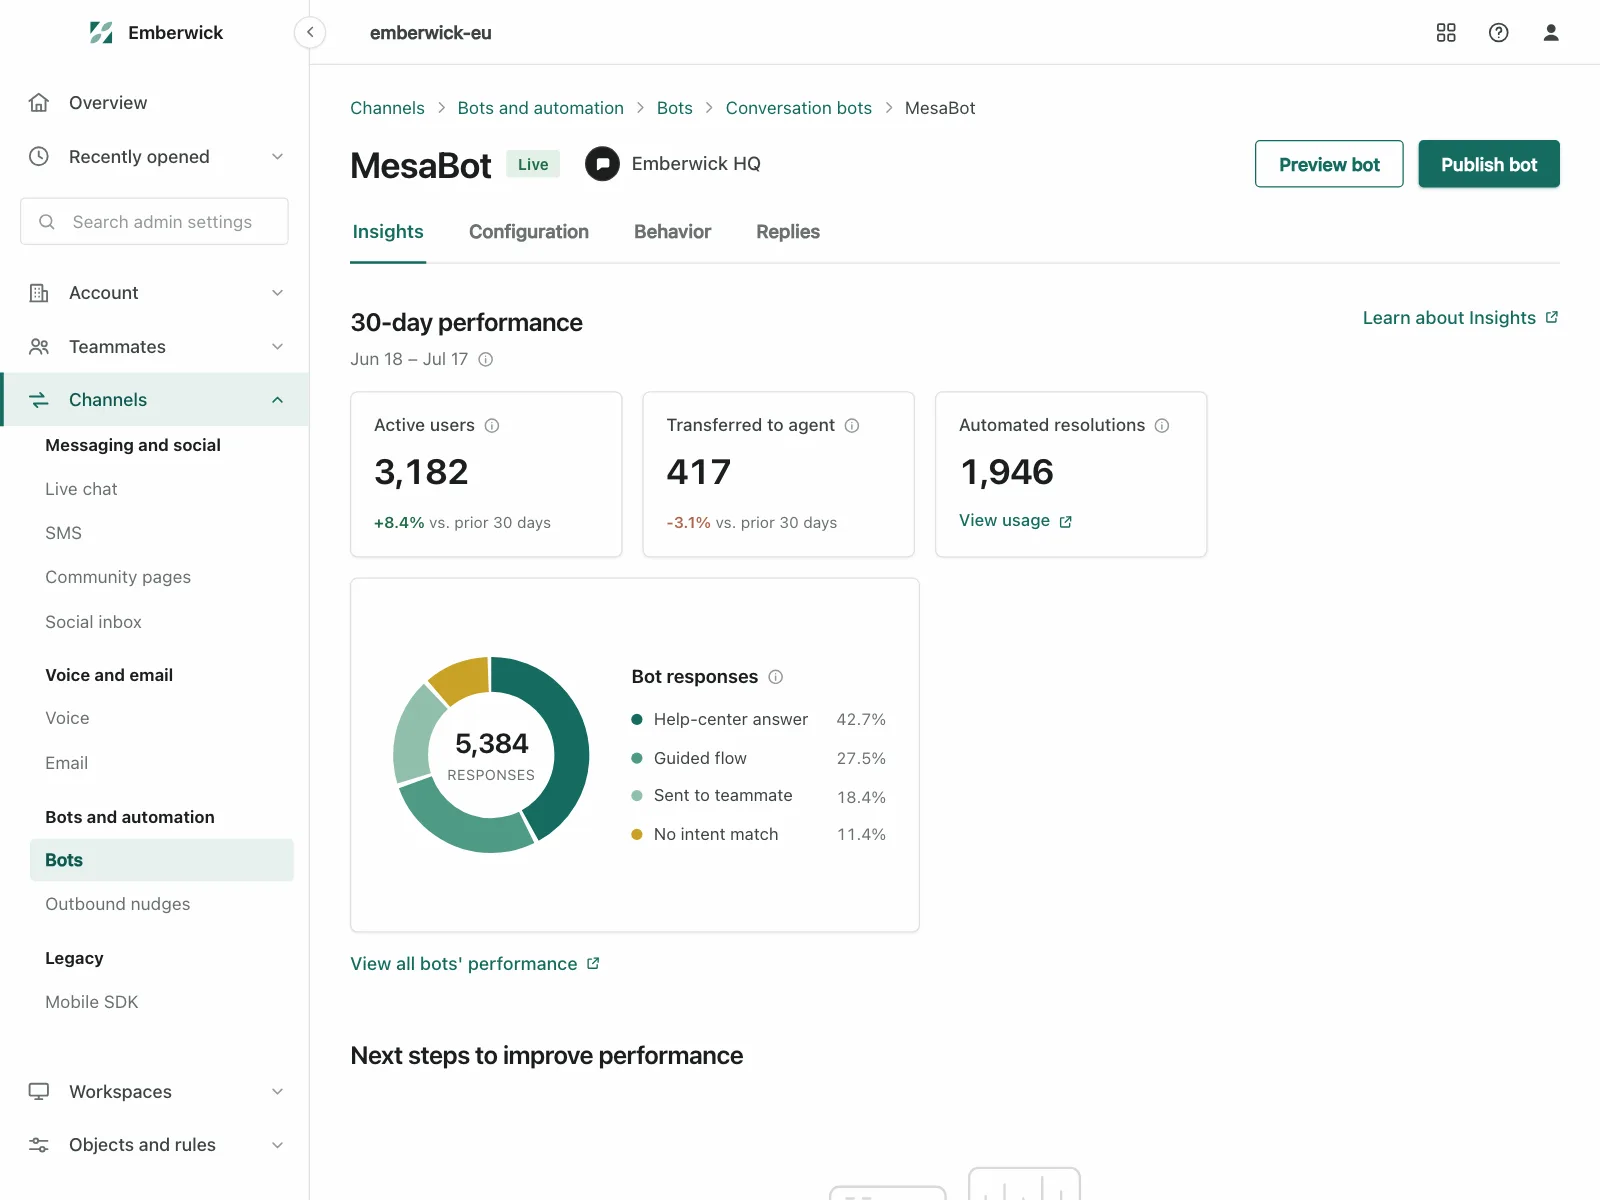
Charts | MesaBot
Charts
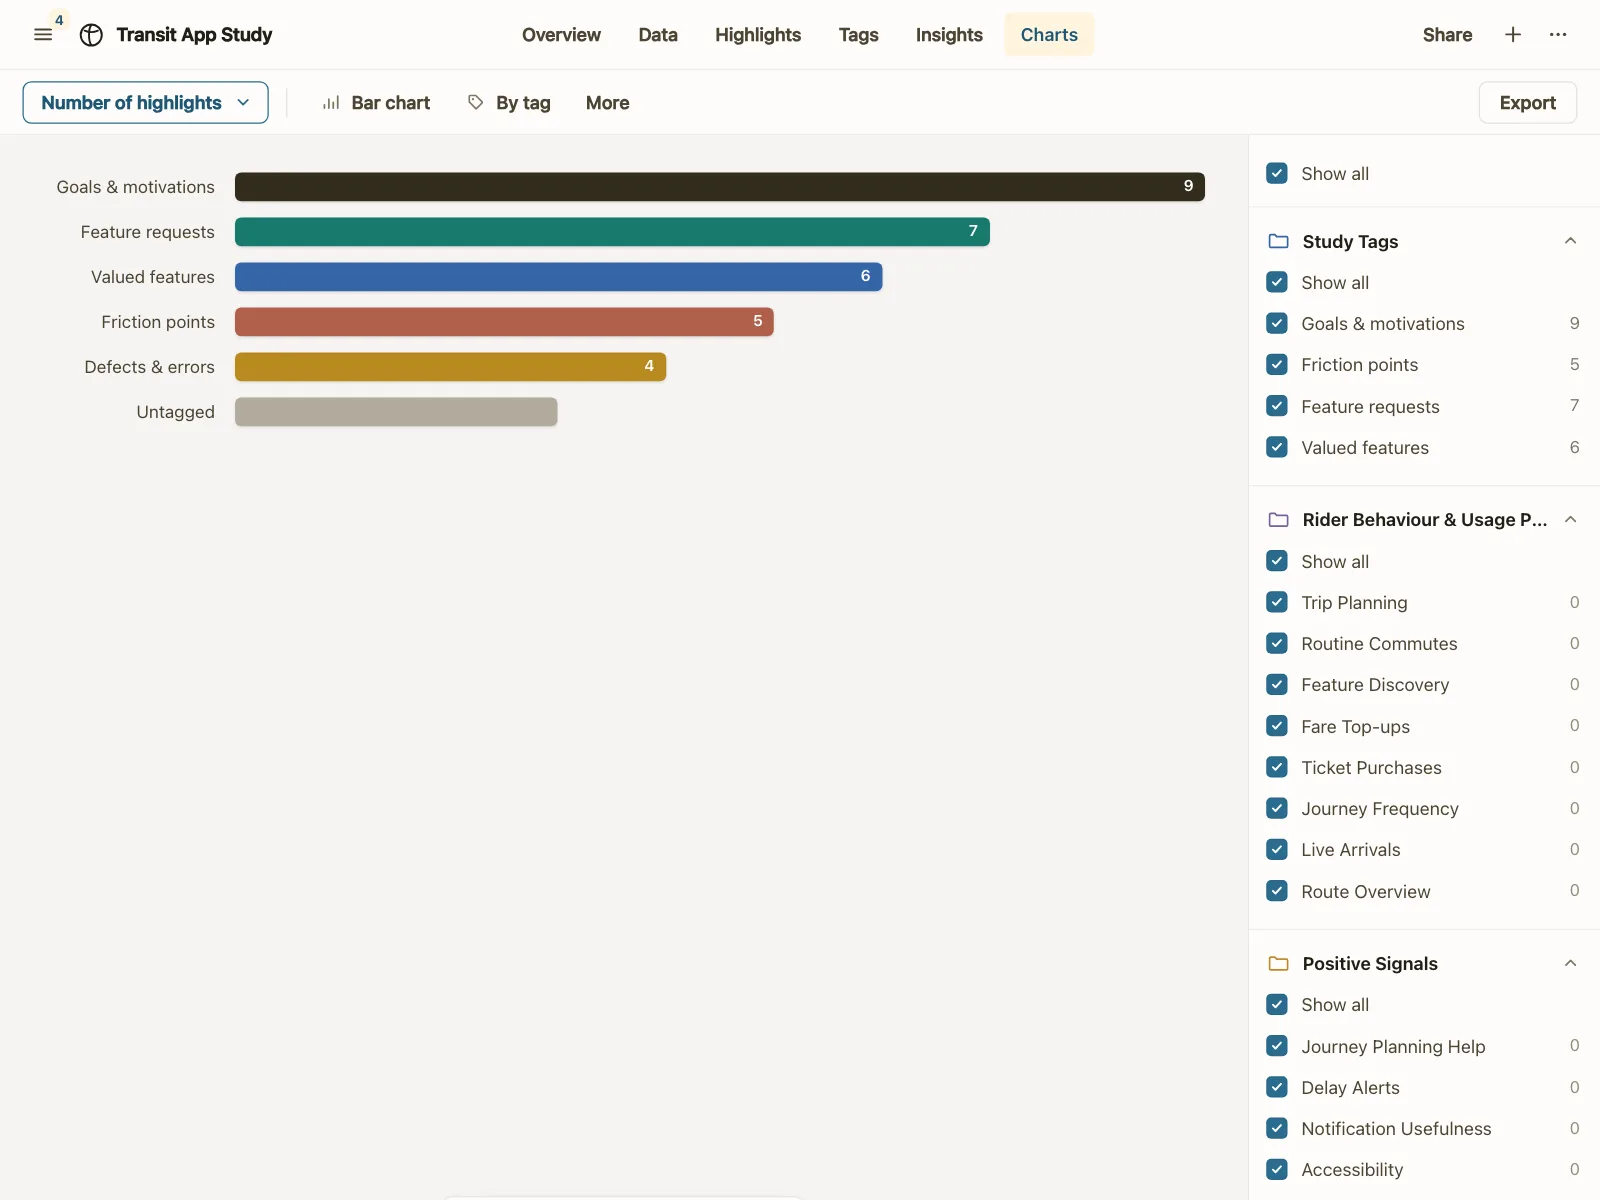
Charts | Calderwood Research
Charts
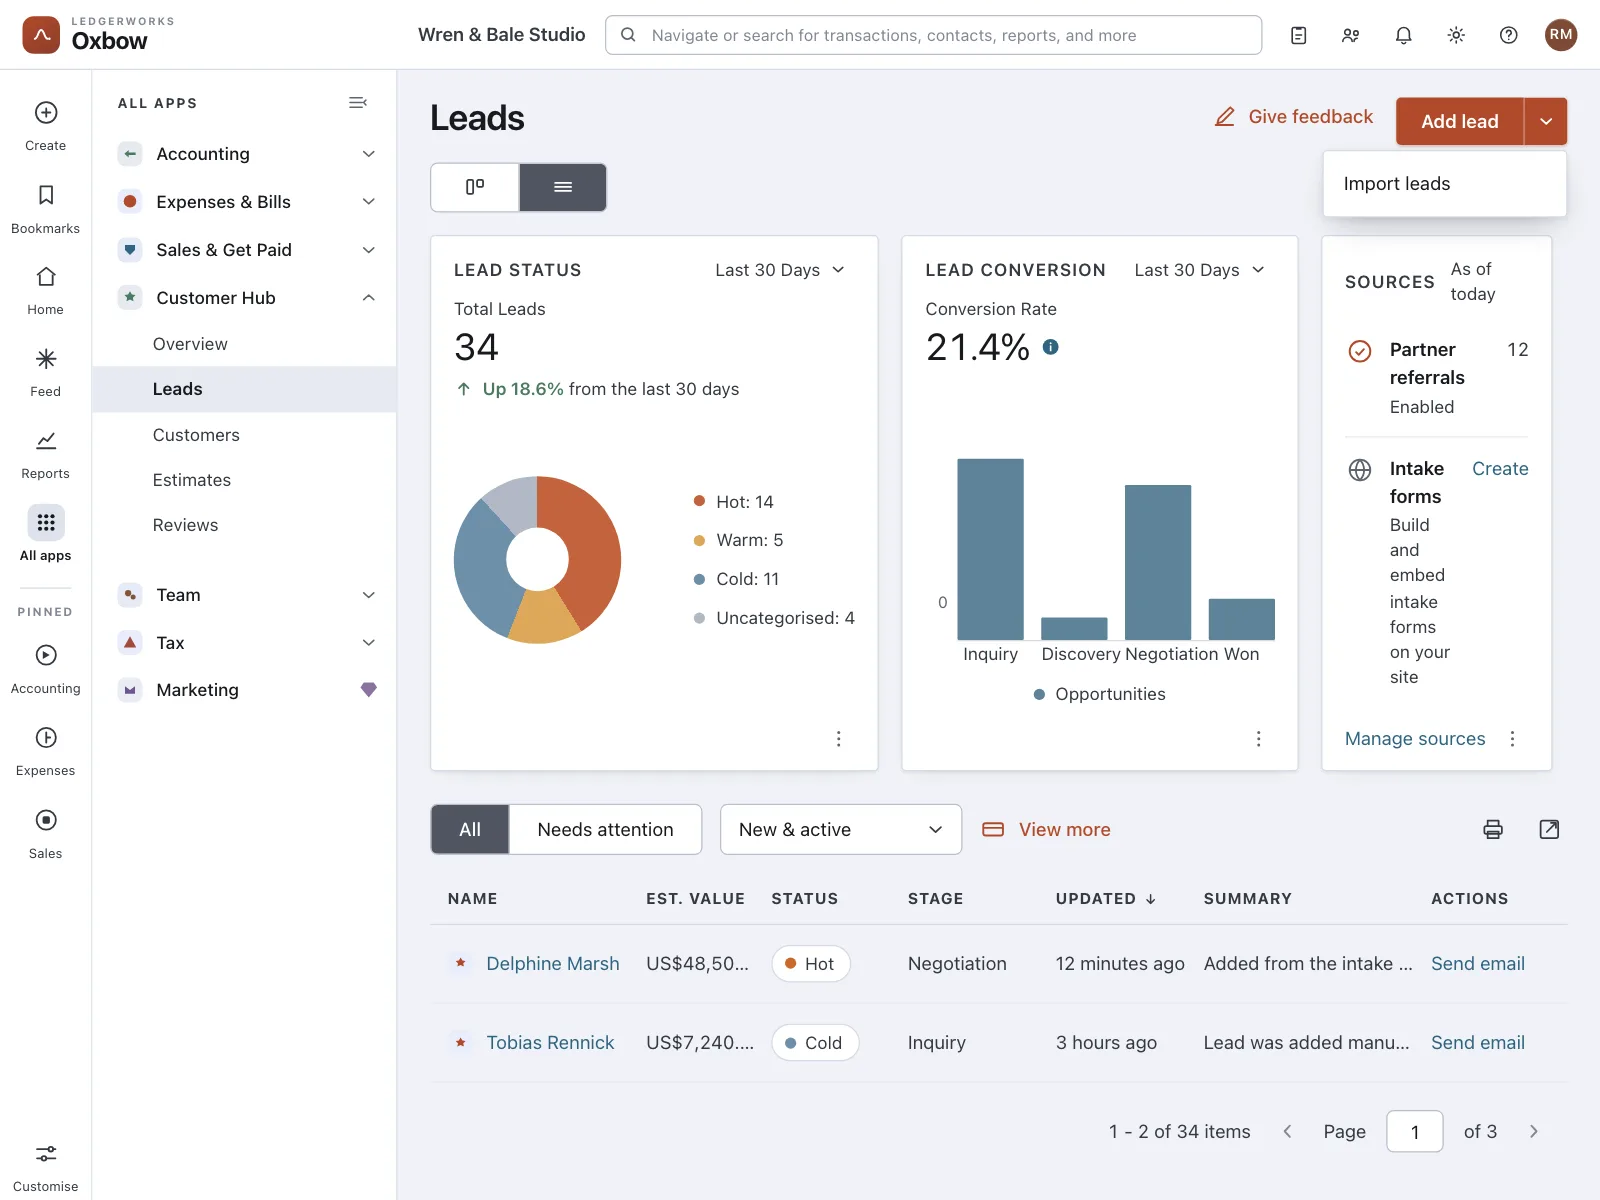
Charts | Oxbow