Relaywave Helpdesk

Charts section#172 of 250Web

About this design

Charts section for Web: conversations report for a helpdesk platform, volume broken out by hour and weekday.

  • Style: light mode, cool grey canvas, white cards, dark navy rail, muted gold accent, square corners.

  • Layout: report header and filter row above a five-tile metric strip, then paired bar charts.
  • Components: KPI value tiles, hourly share and weekday average bar plots, export buttons.

  • Vibe: neutral, orderly, operational — support analytics.

More Charts sections

View all 250
Charts
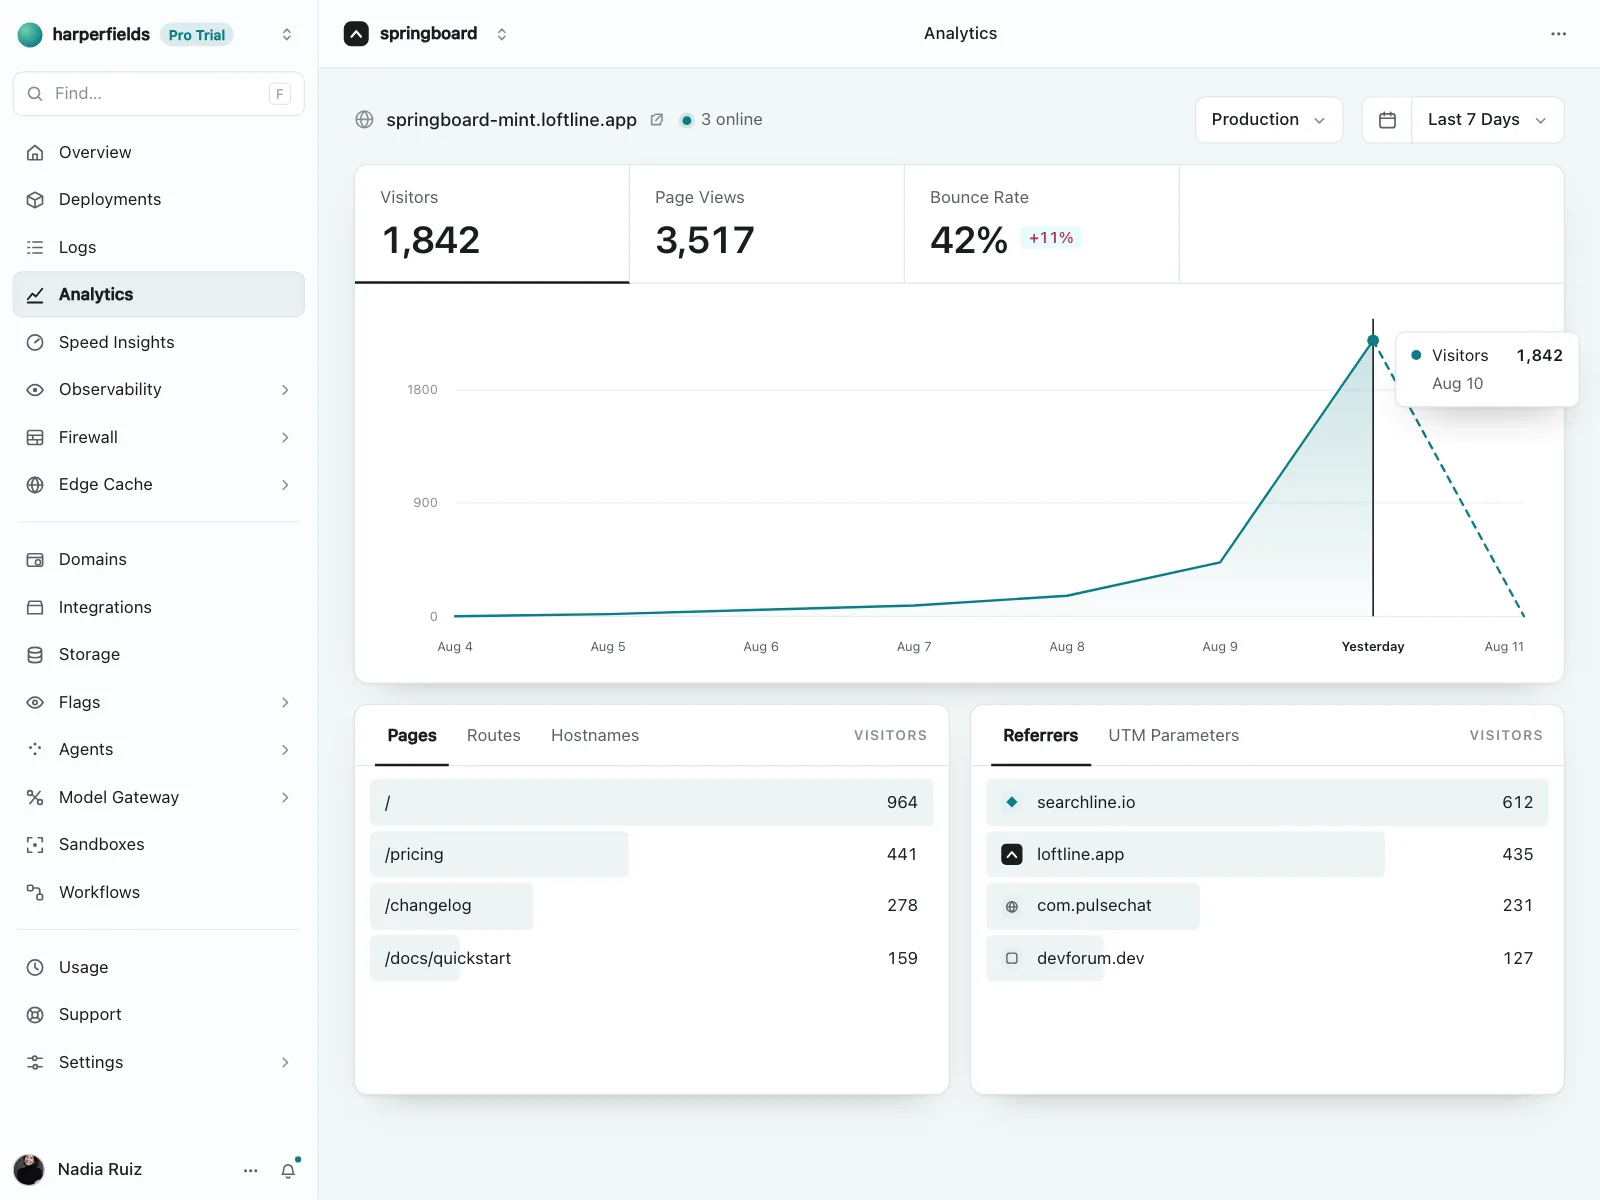
Charts | Loftline
Charts
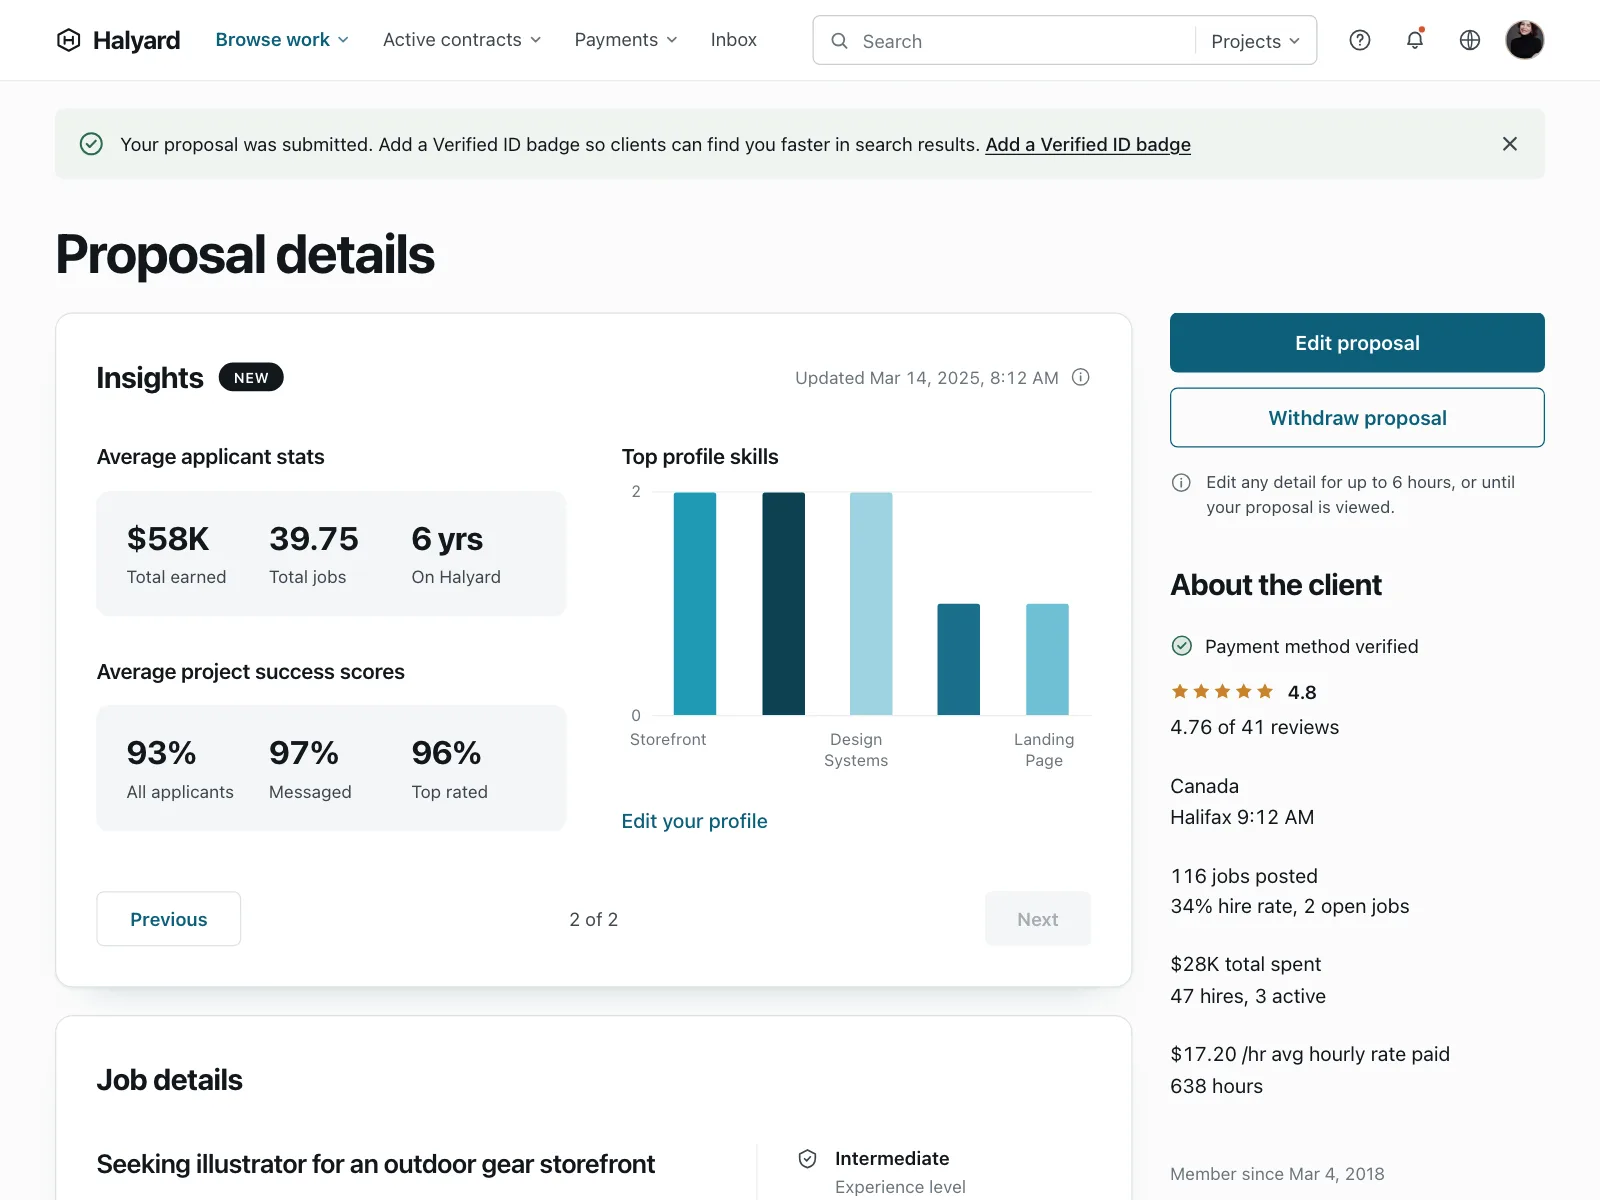
Charts | Halyard
Charts
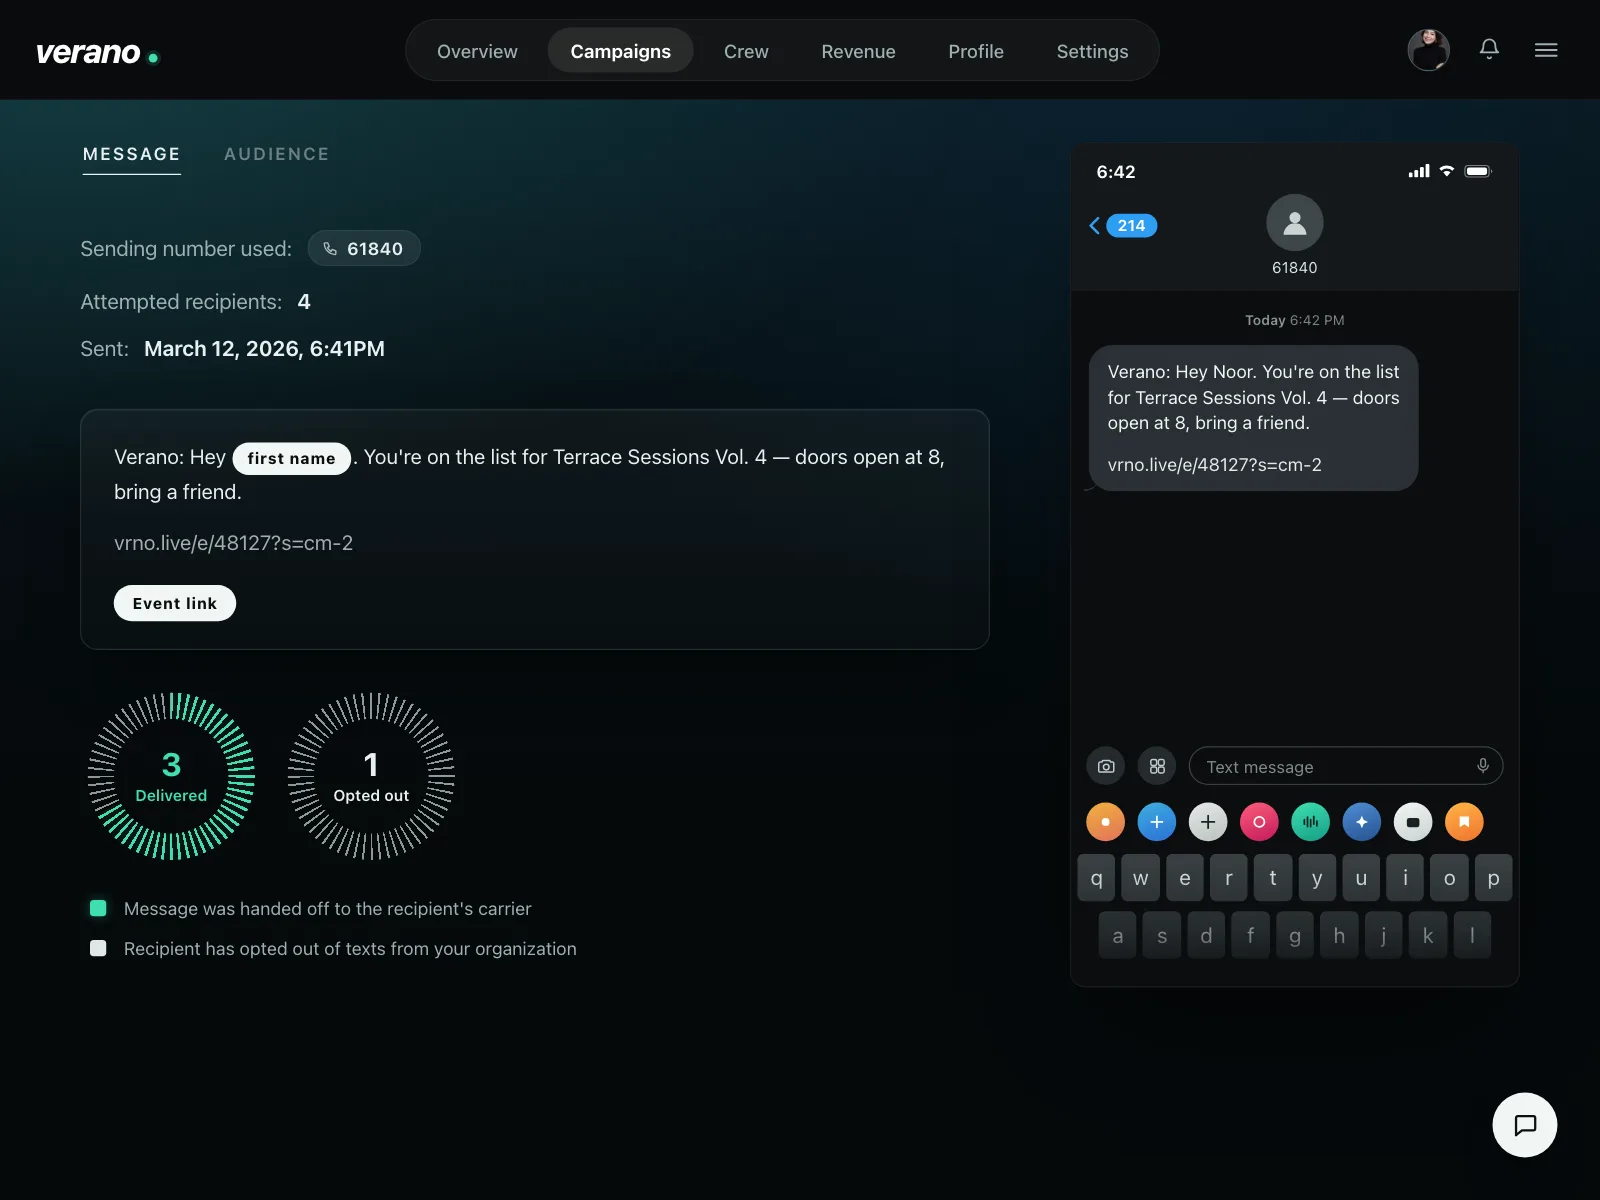
Charts | Verano
Charts
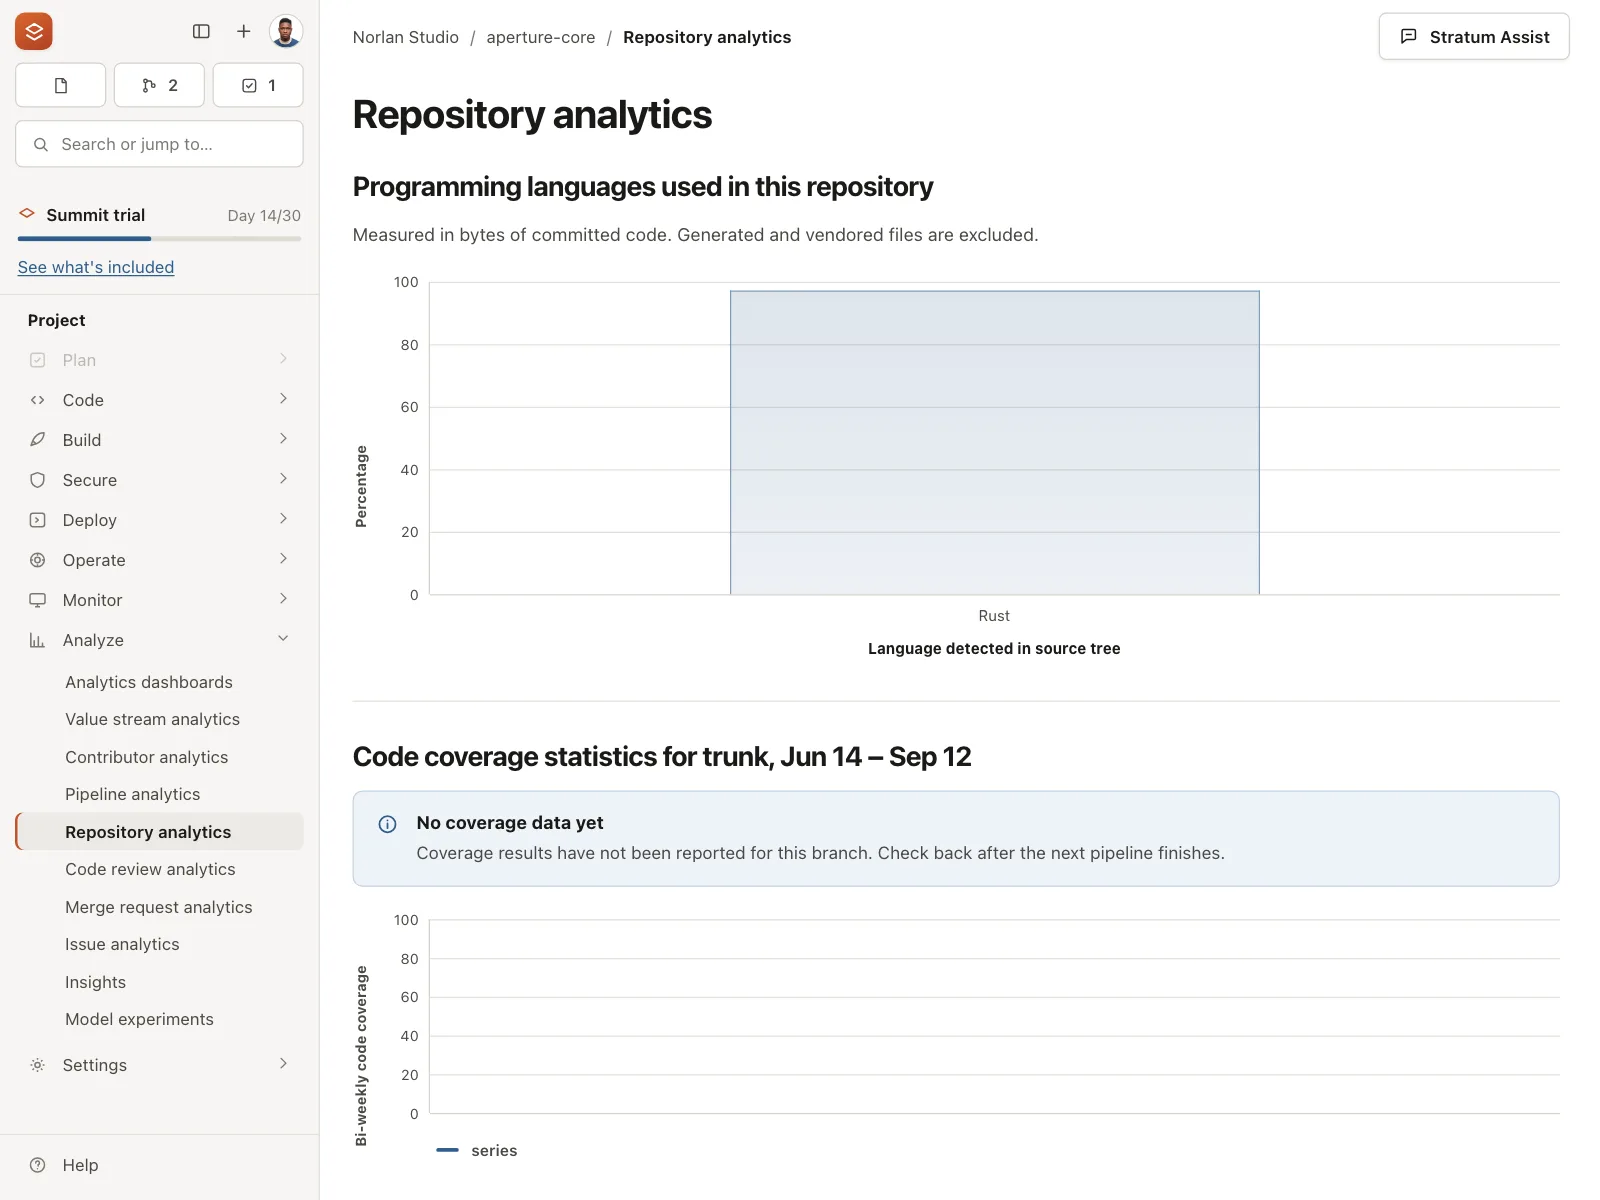
Charts | Stratum