About this design
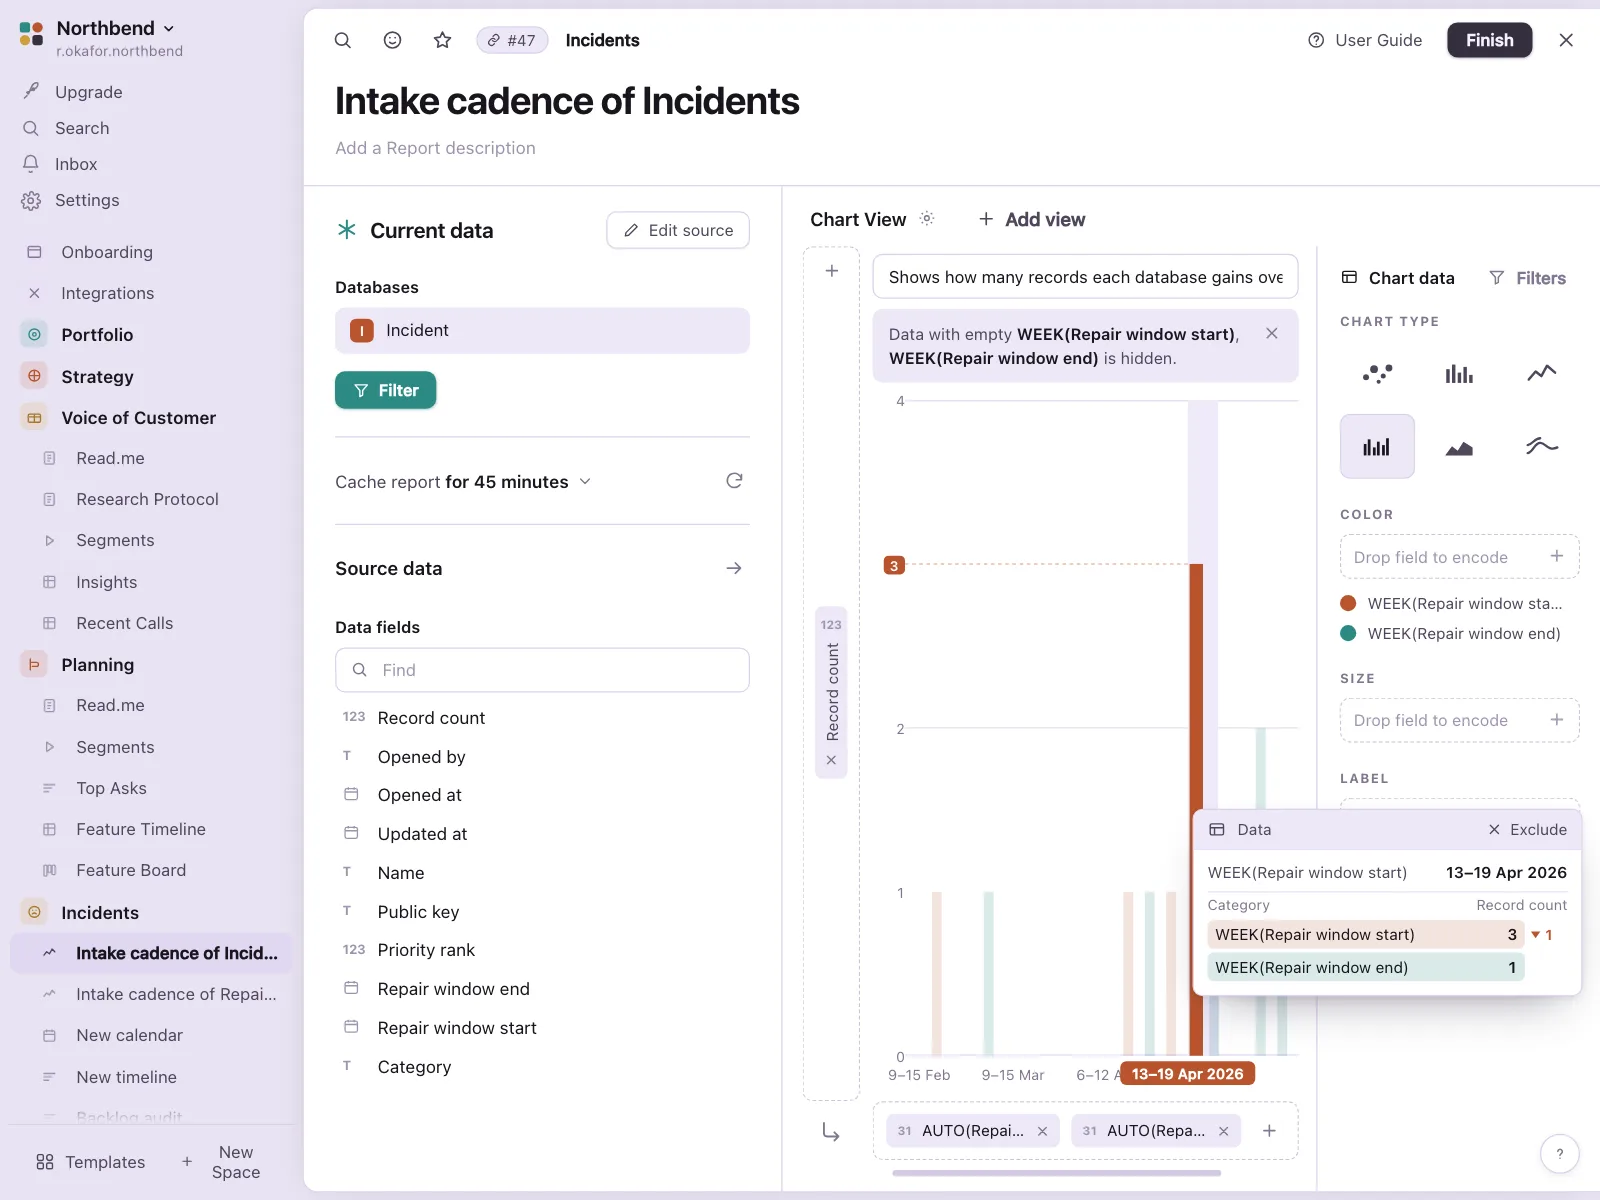
Insights report for a retail brand built in an event analytics workspace.
- Style
- light mode, cool grey page, white working panel, teal accent, mono numerals, lightly rounded controls.
- Layout
- three column shell of nav, chart canvas and query panel, line chart above a table.