Kestrel

Charts section#154 of 250Web

About this design

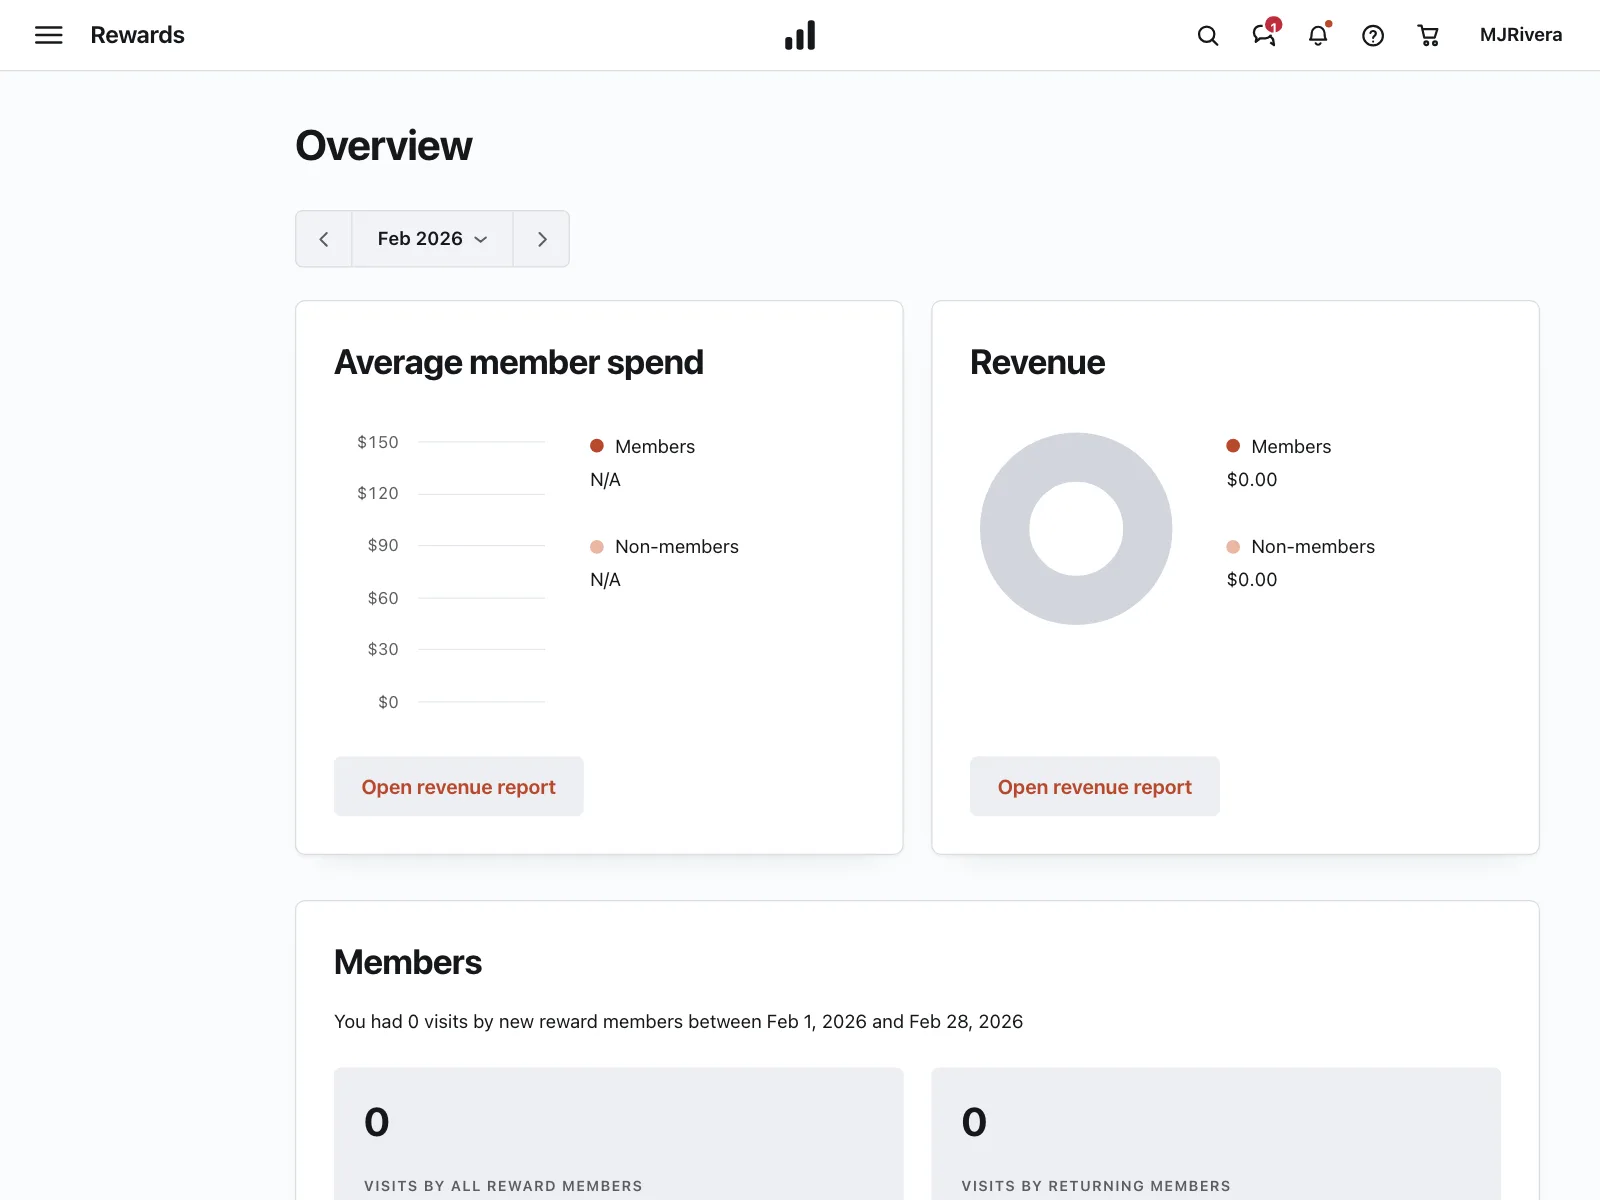
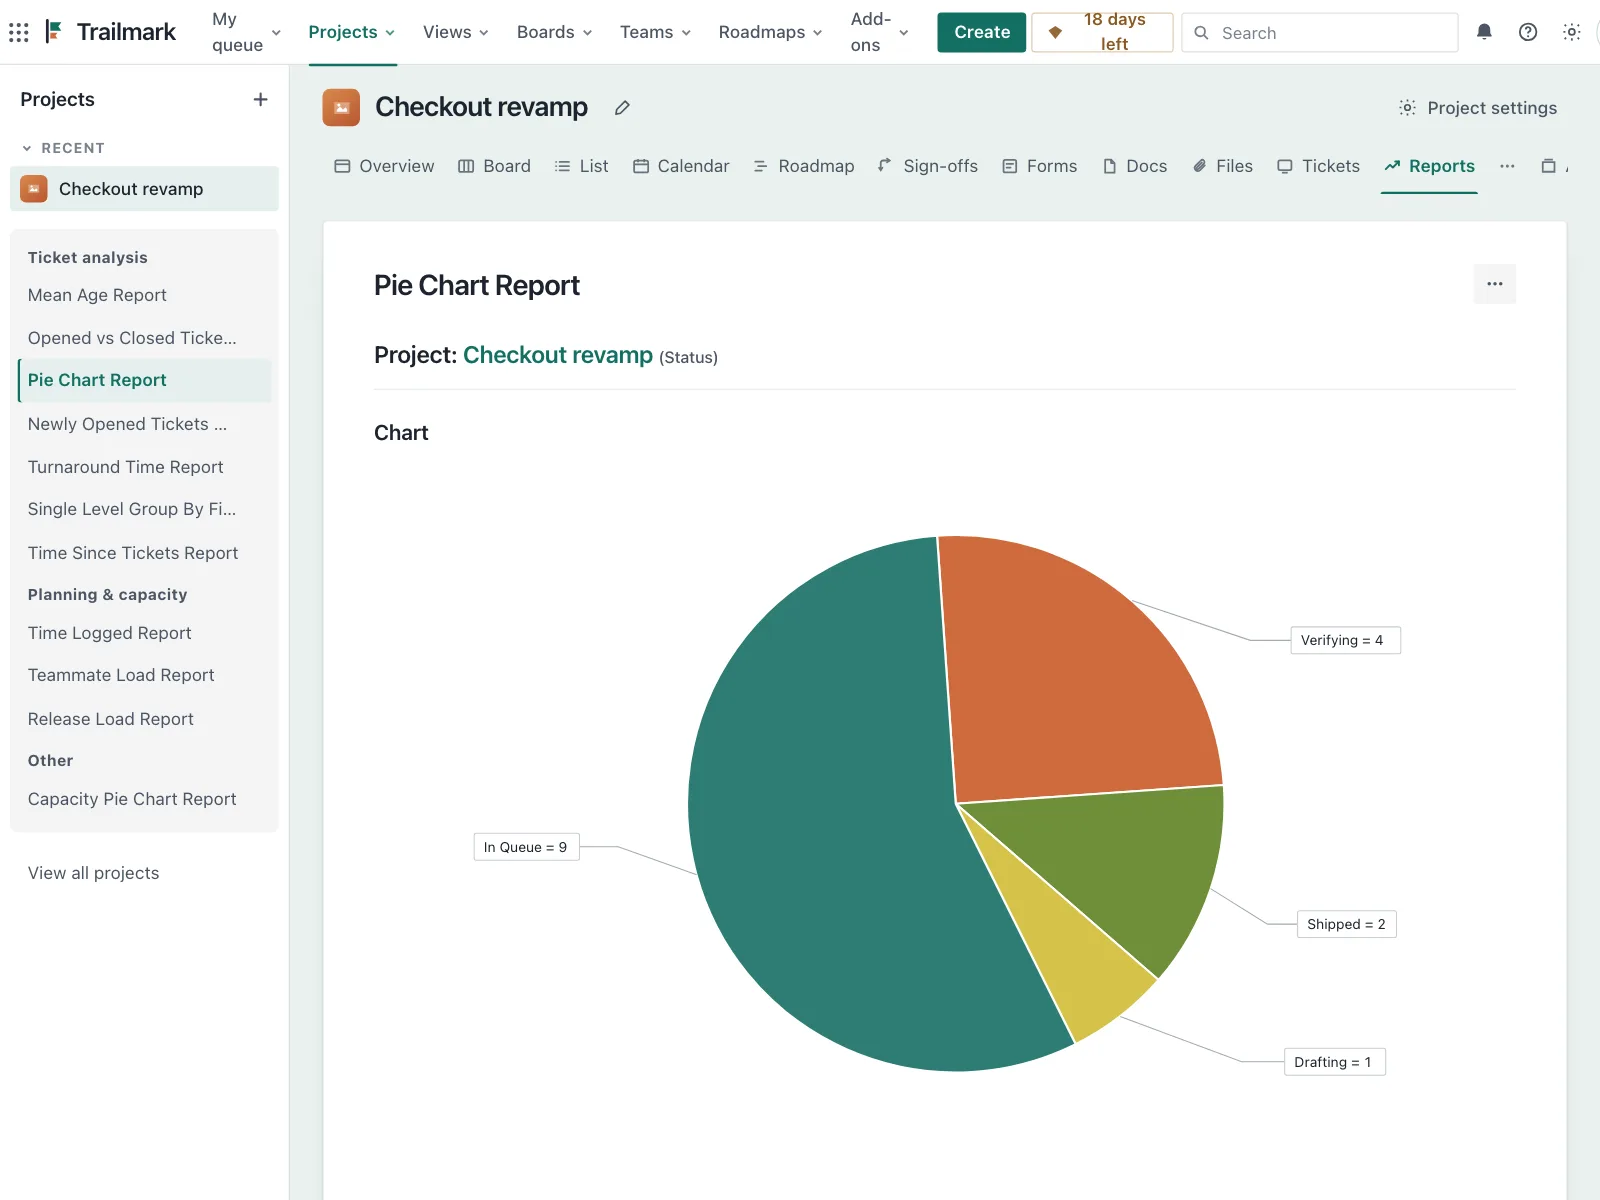
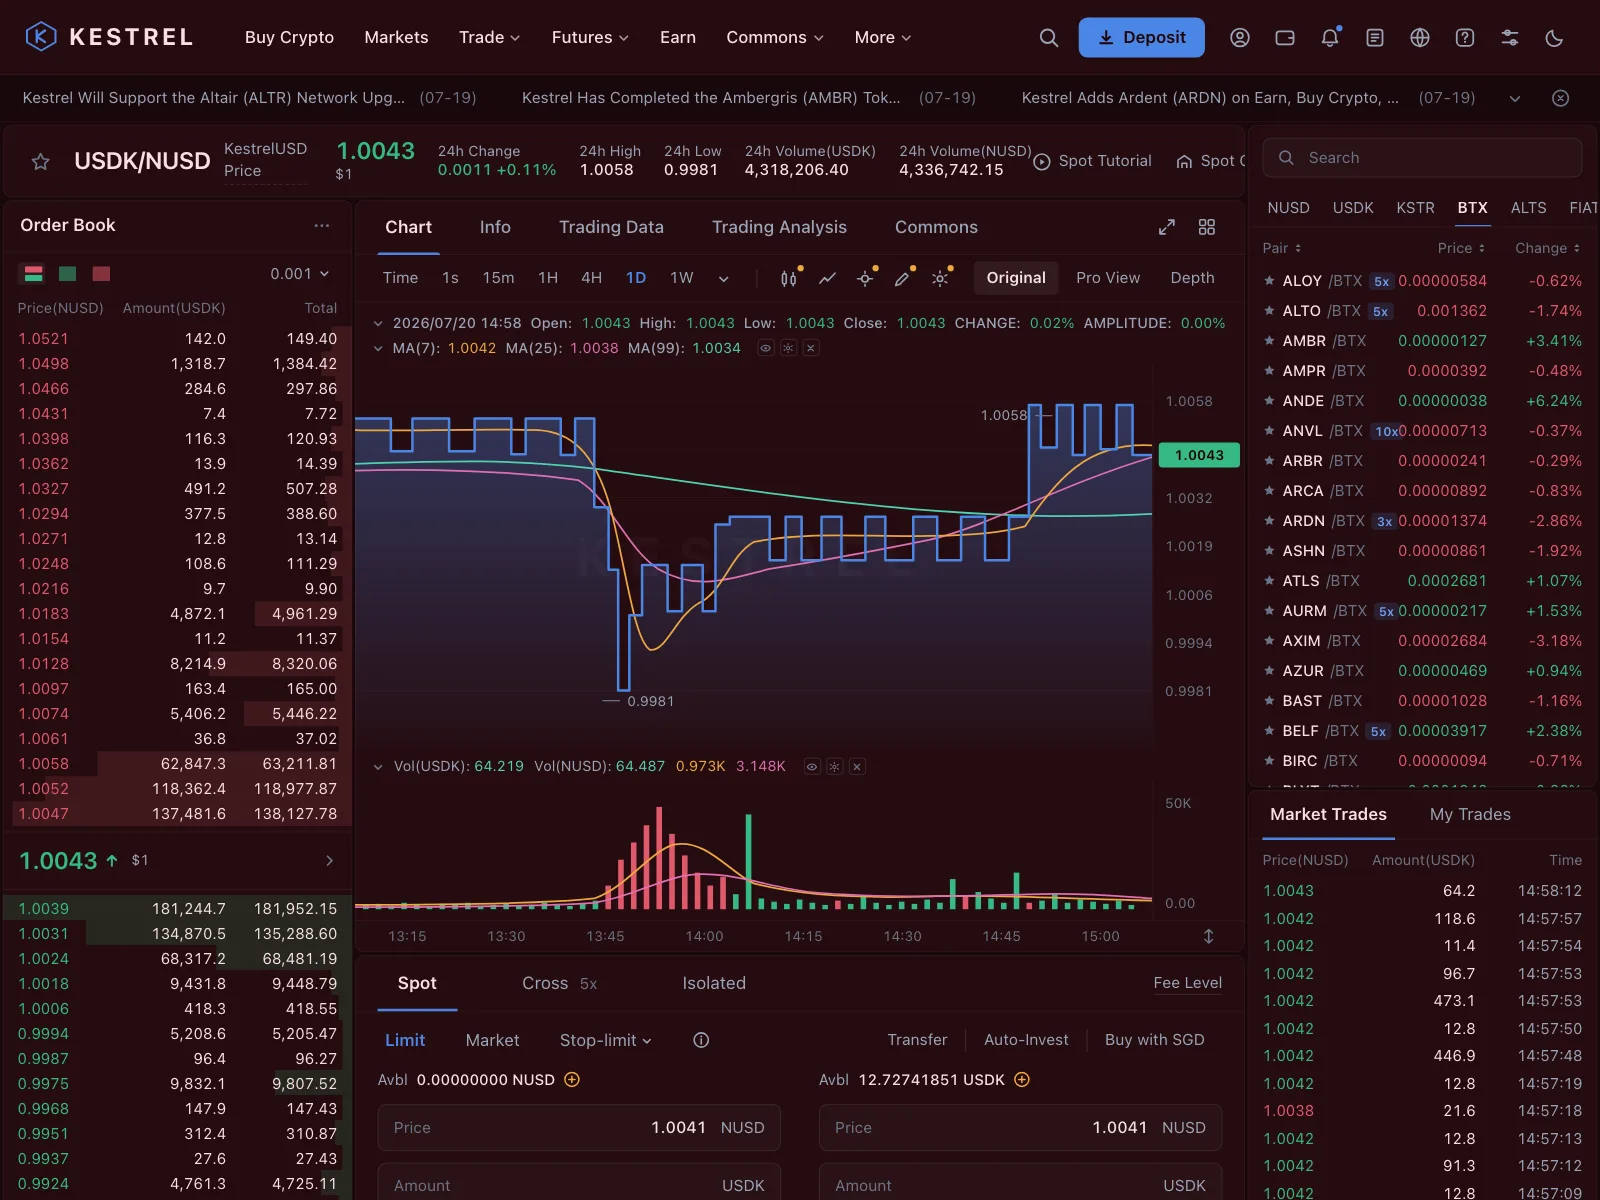
Charts section for Web: capital flow analysis tab of a crypto exchange terminal, breaking down large inflows.

  • Style: dark mode, deep teal-black canvas, graphite panels, sky blue and mint data colours, tight sans figures.

  • Layout: left detail column beside chart panels over three and two column metric rows.
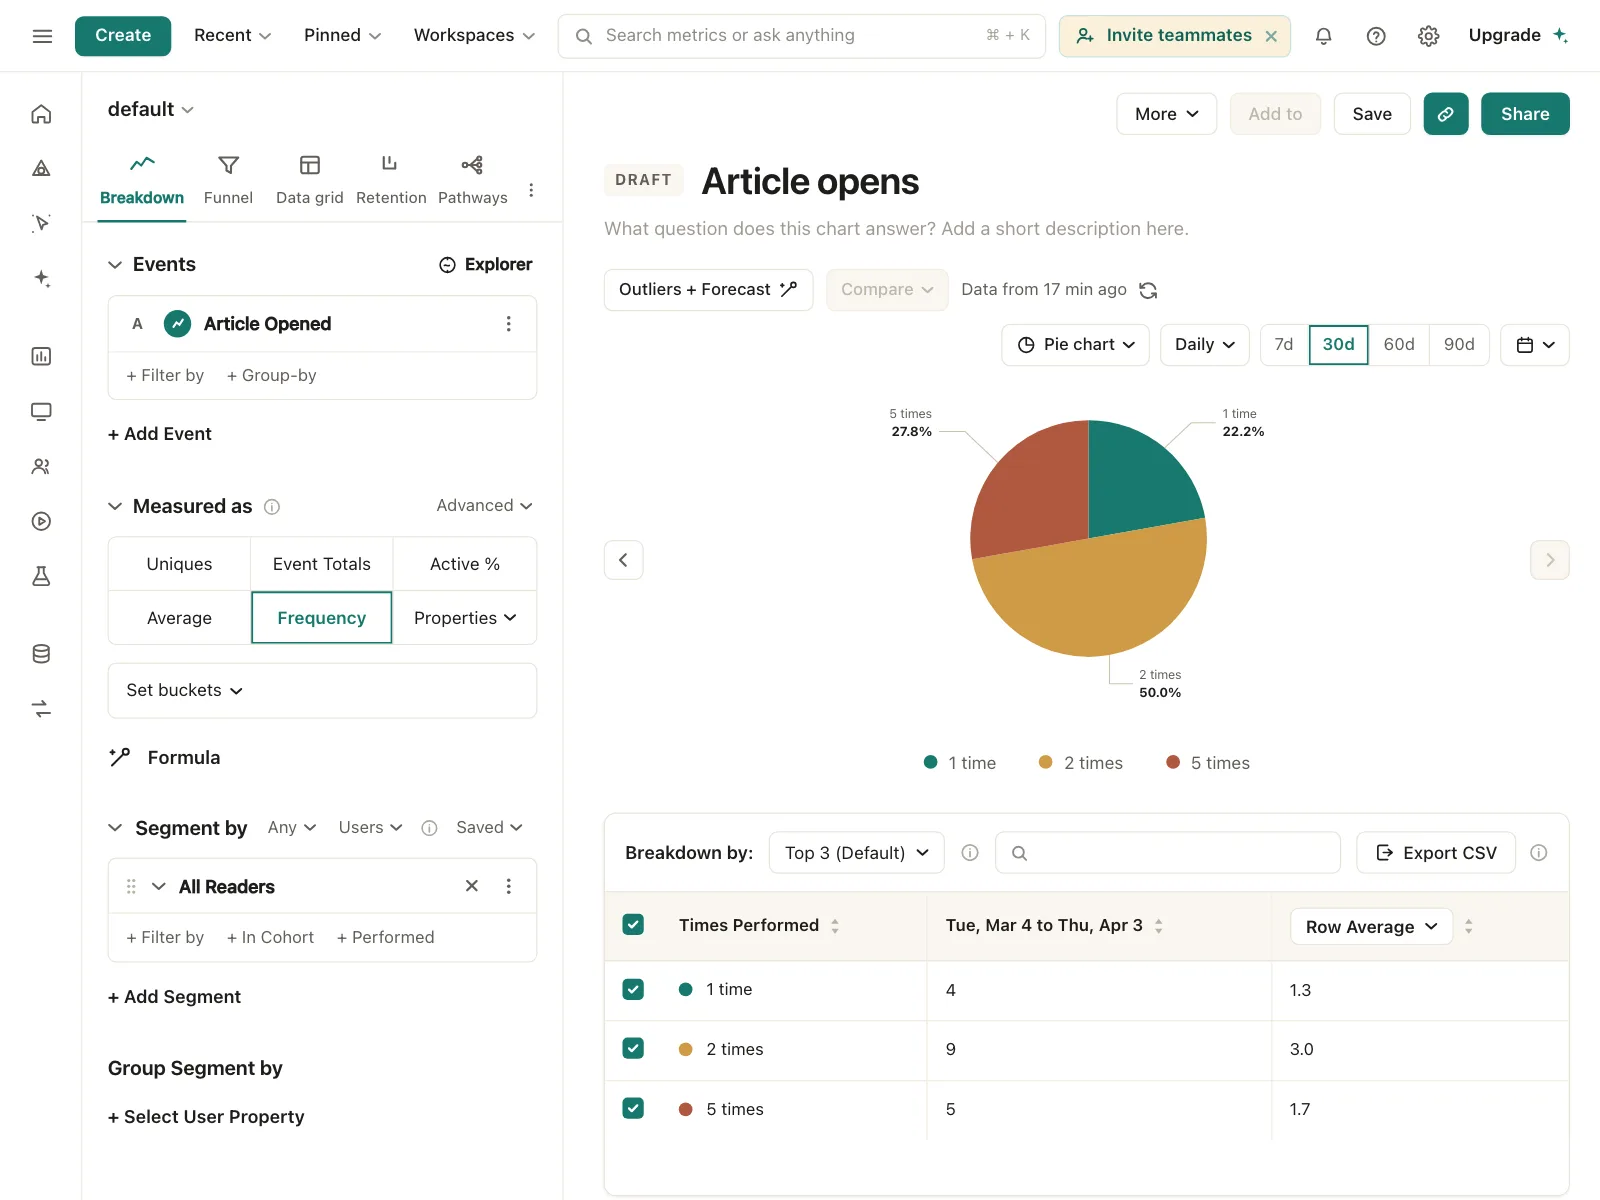
  • Components: inflow line chart with gridlines, buy and sell size legend, donut, timeframe tabs.

  • Vibe: technical, dense, high-signal — crypto trading.

More Charts sections

View all 250
Charts
Charts | Tidepool
Charts
Charts | Wayfare
Charts
Charts | Trailmark
Charts
Charts | Kestrel