Rookline Analytics

Charts section#106 of 250Web

About this design

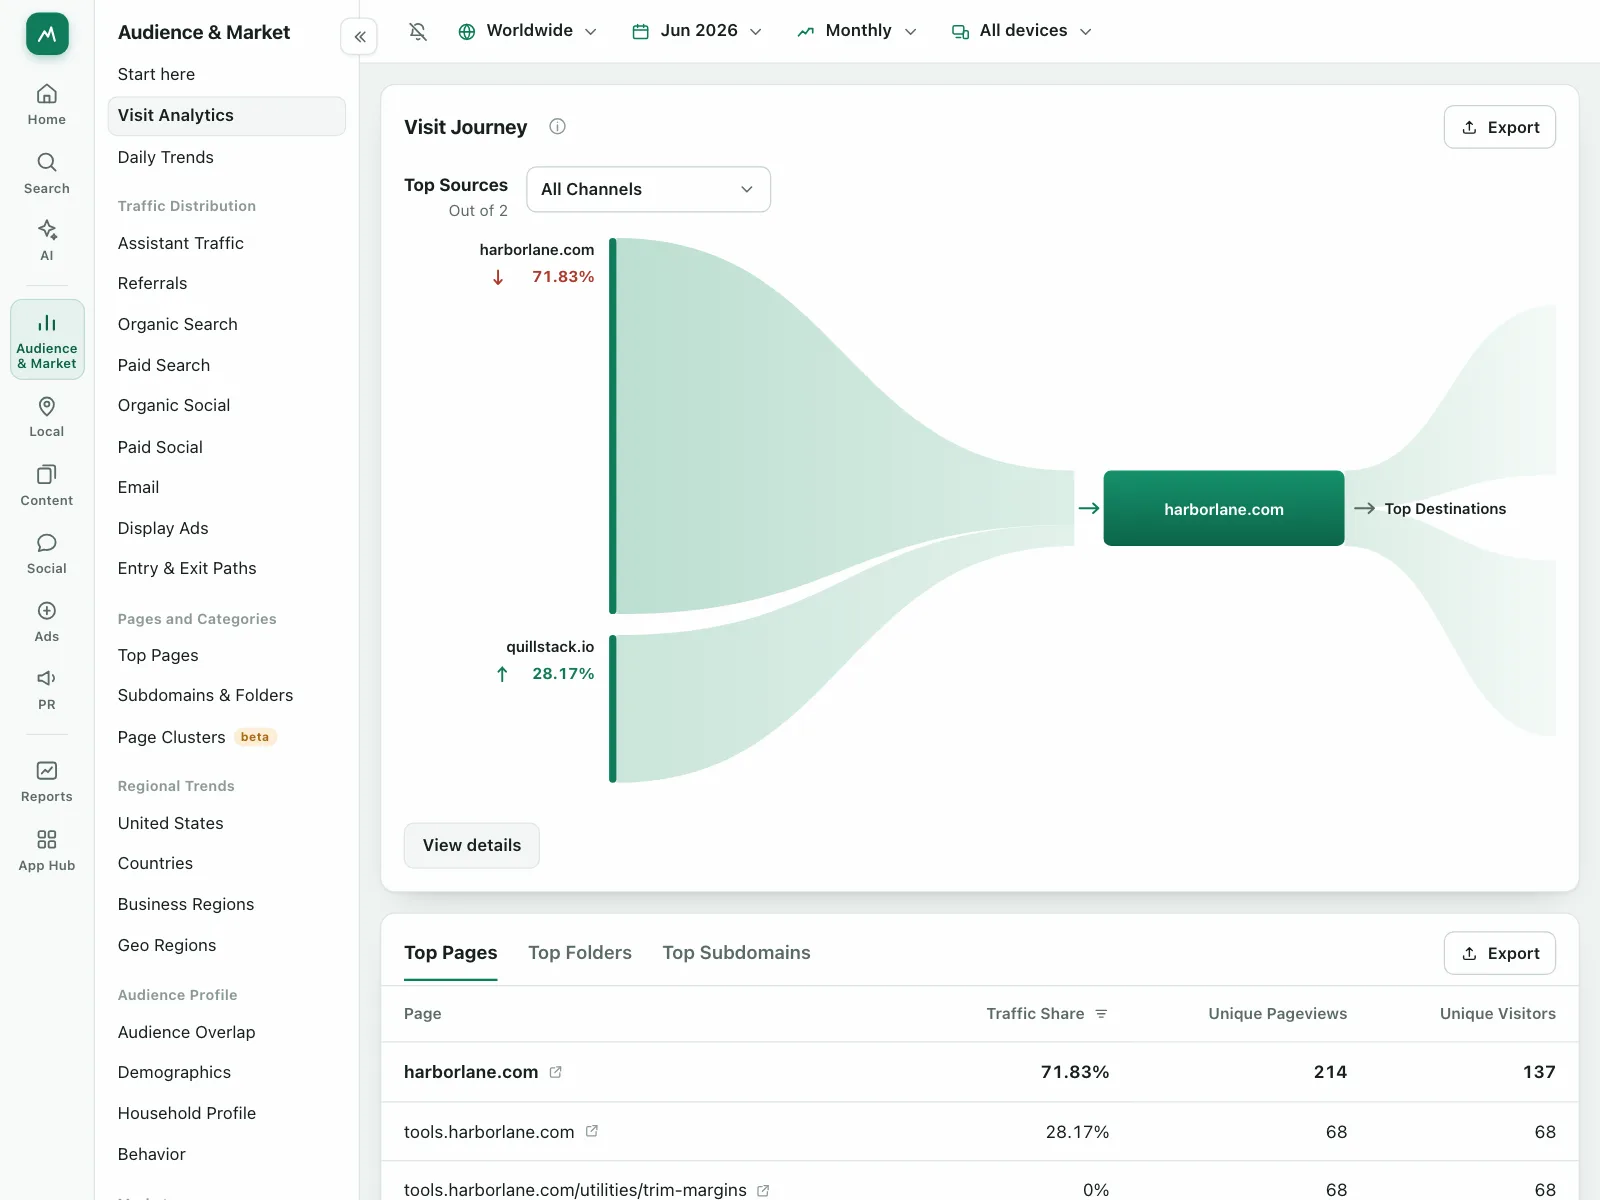
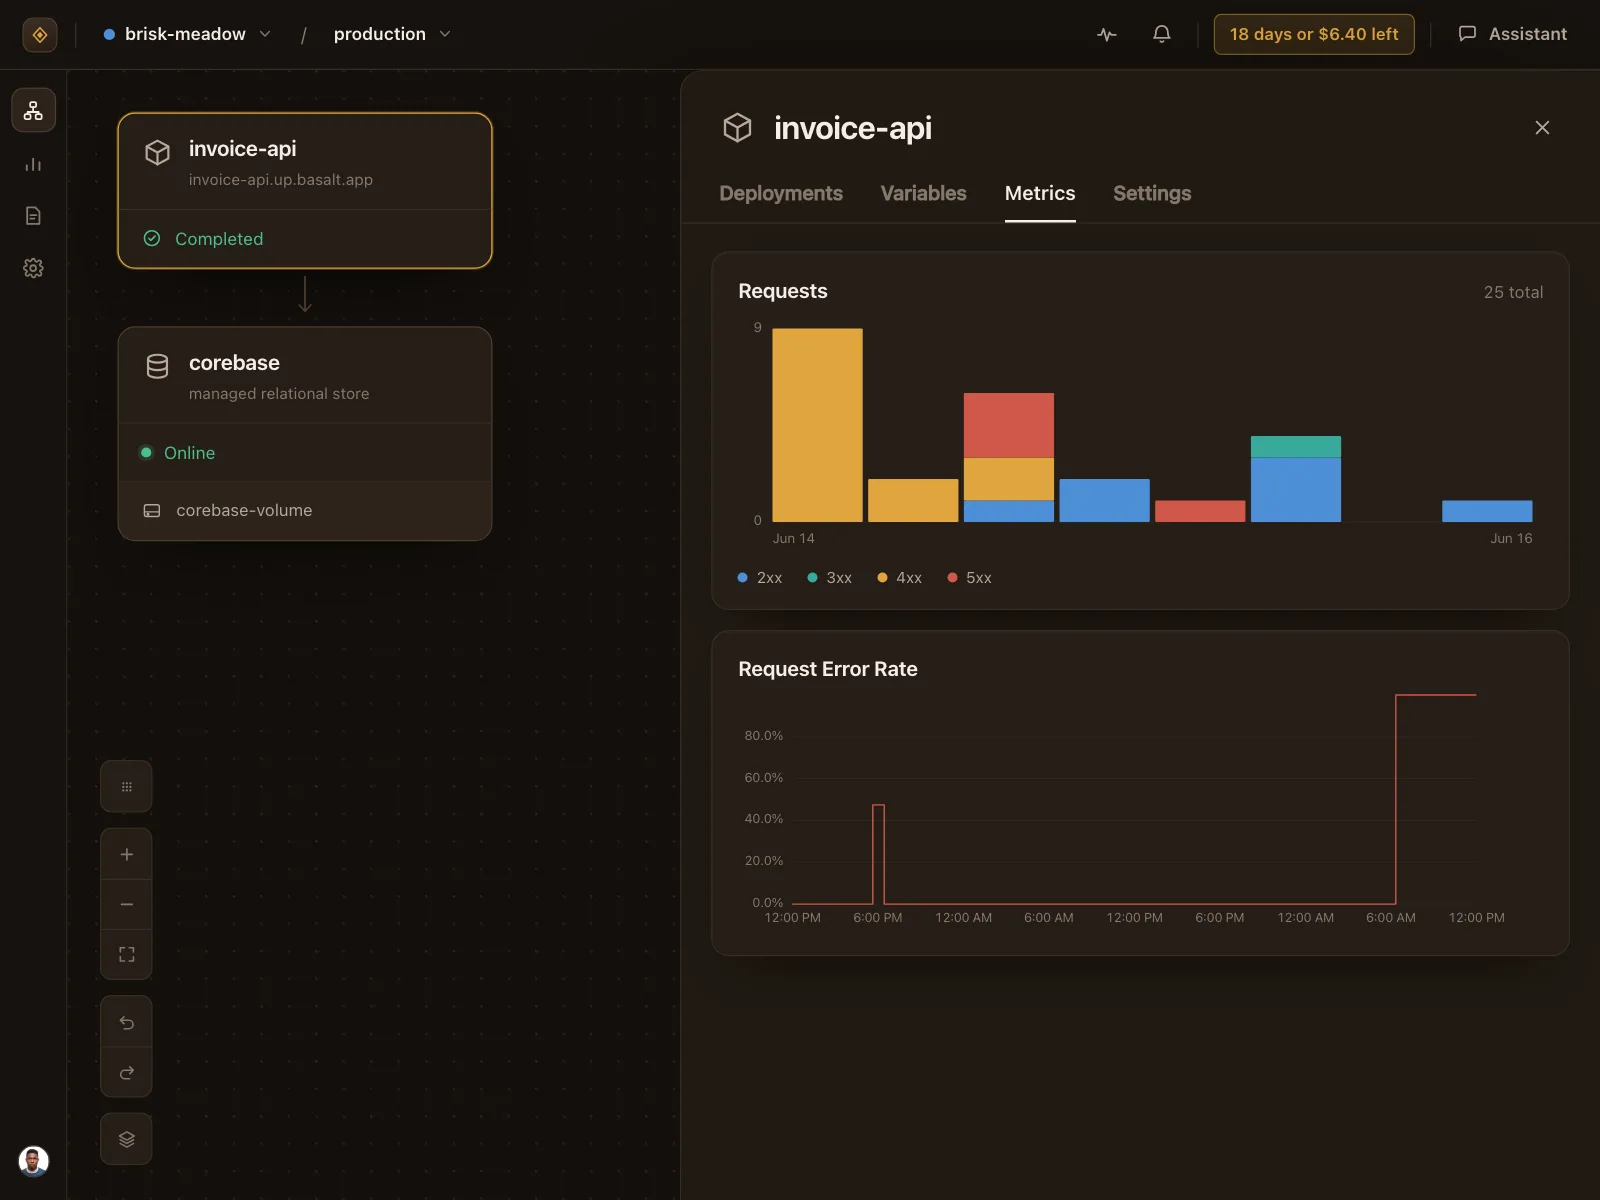
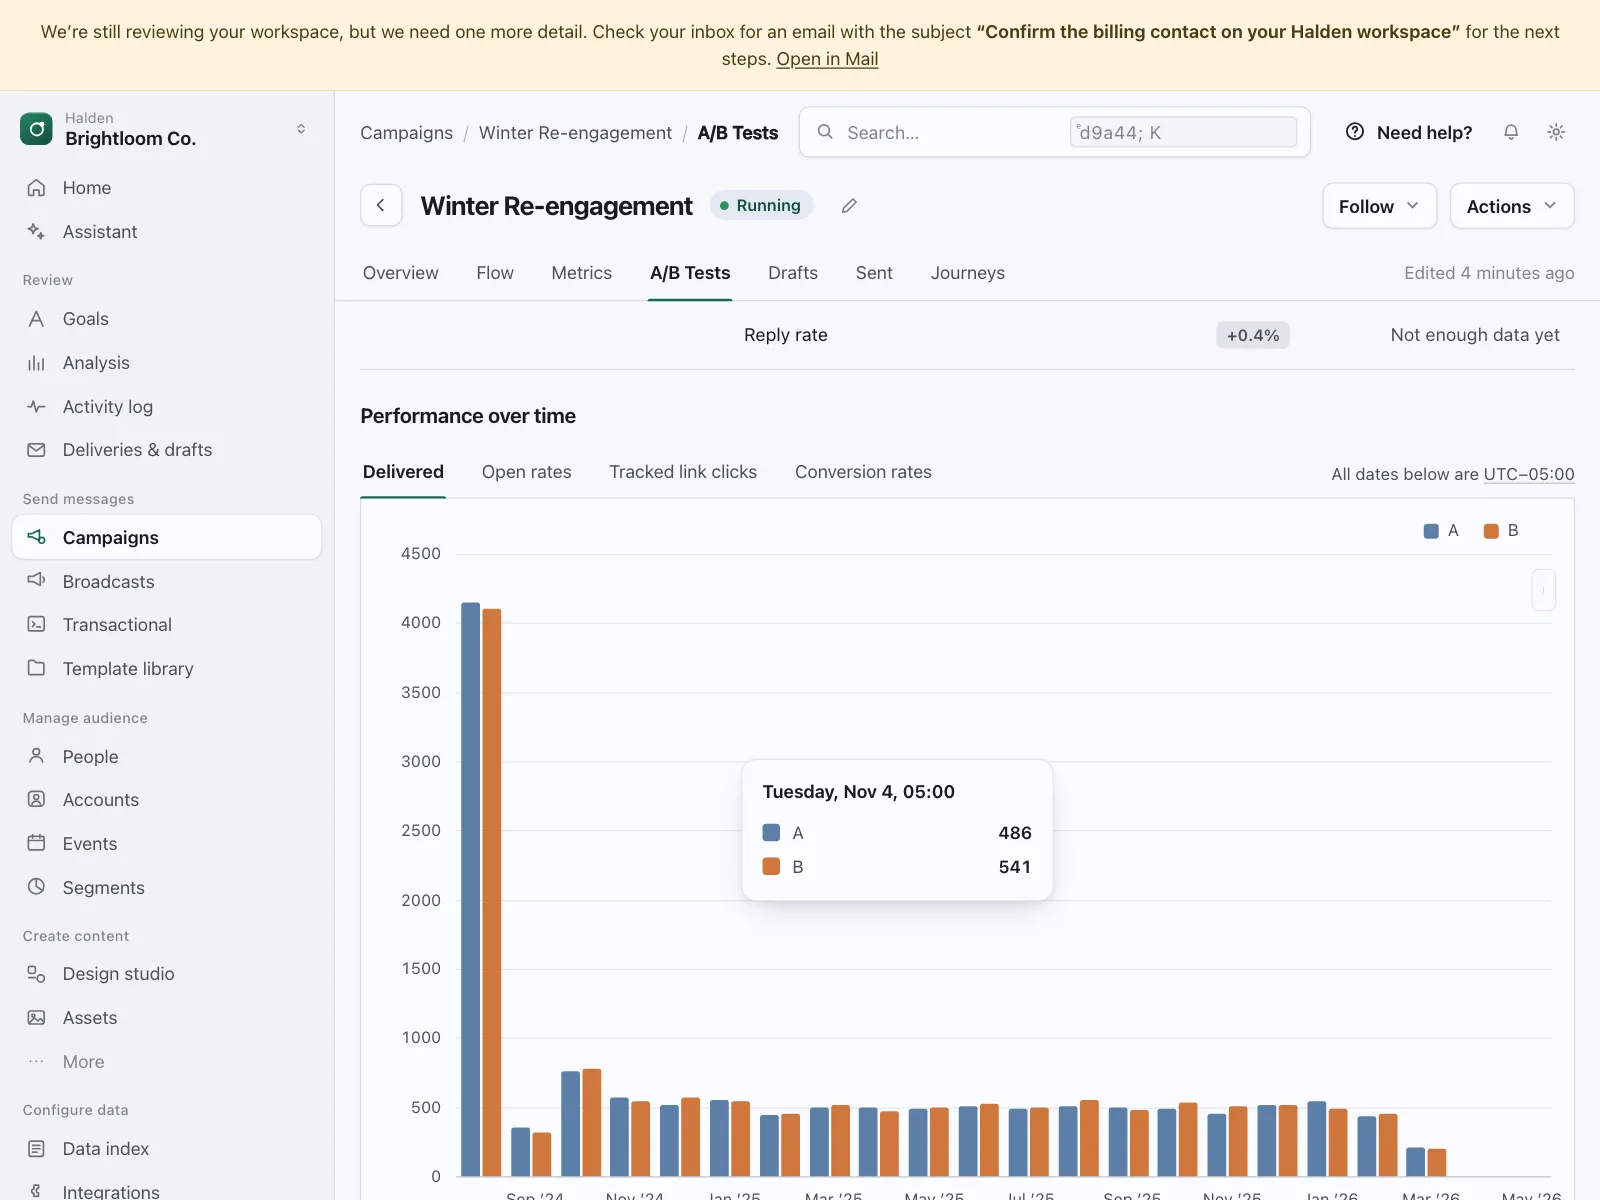
Charts section for Web: financial KPI board in Rookline, an accounting analytics add-on for advisors.

  • Style: light mode, lavender-tinted off-white canvas under white sheets, brick red and dark green figures, serif numerals.

  • Layout: three-column widget grid beneath a period and column-count toolbar.
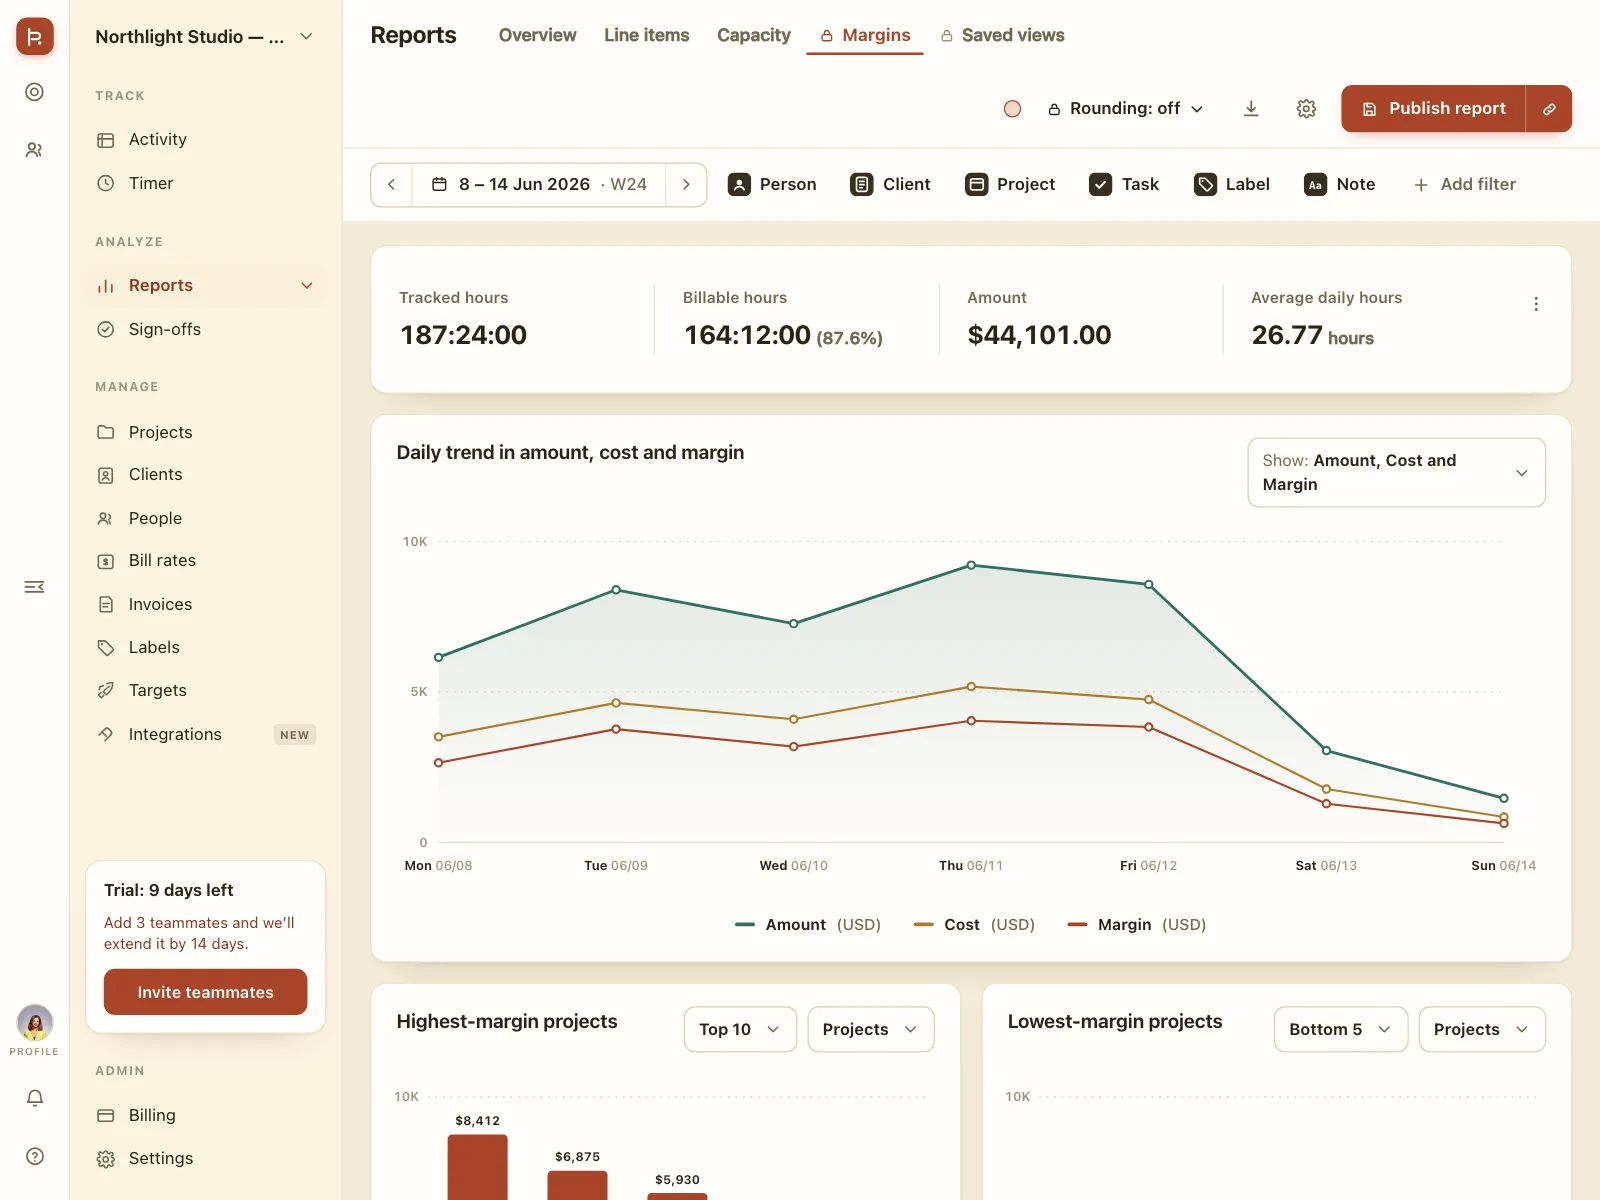
  • Components: cash movement chart, expense and margin tiles with prior-period figures, operating expense breakdown, AI insight links, export buttons.

  • Vibe: editorial, analytical, advisory — accounting analytics.

More Charts sections

View all 250
Charts
Charts | Halyard
Charts
Charts | Larksight
Charts
Charts | Basalt
Charts
Charts | Halden