About this design
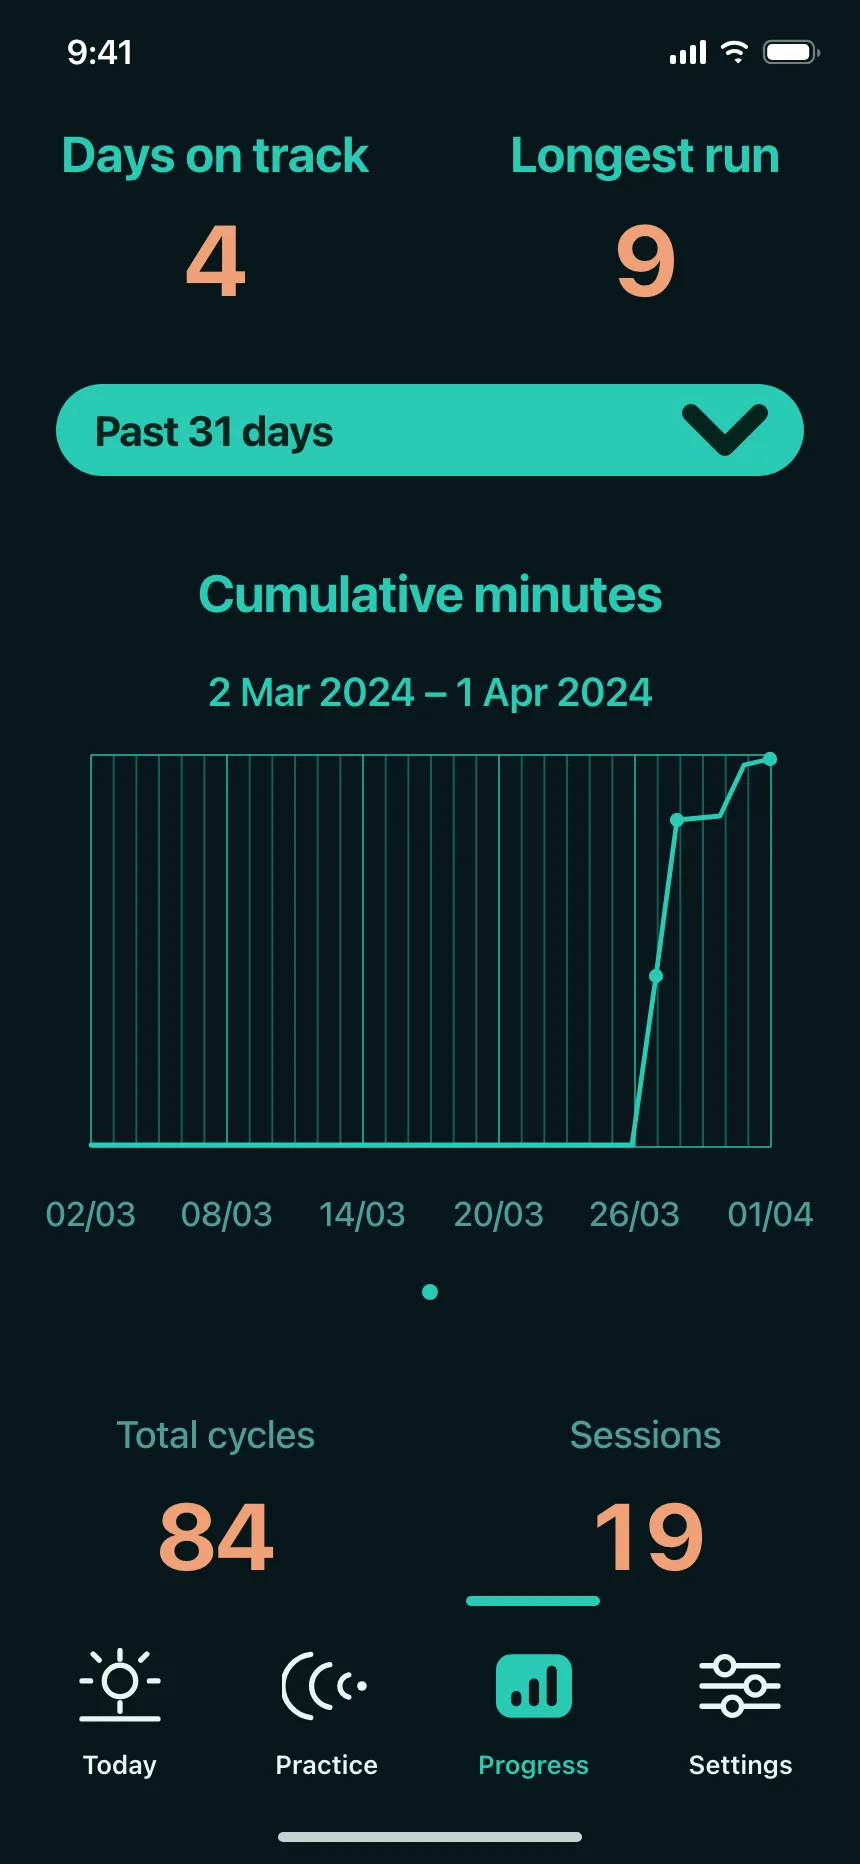
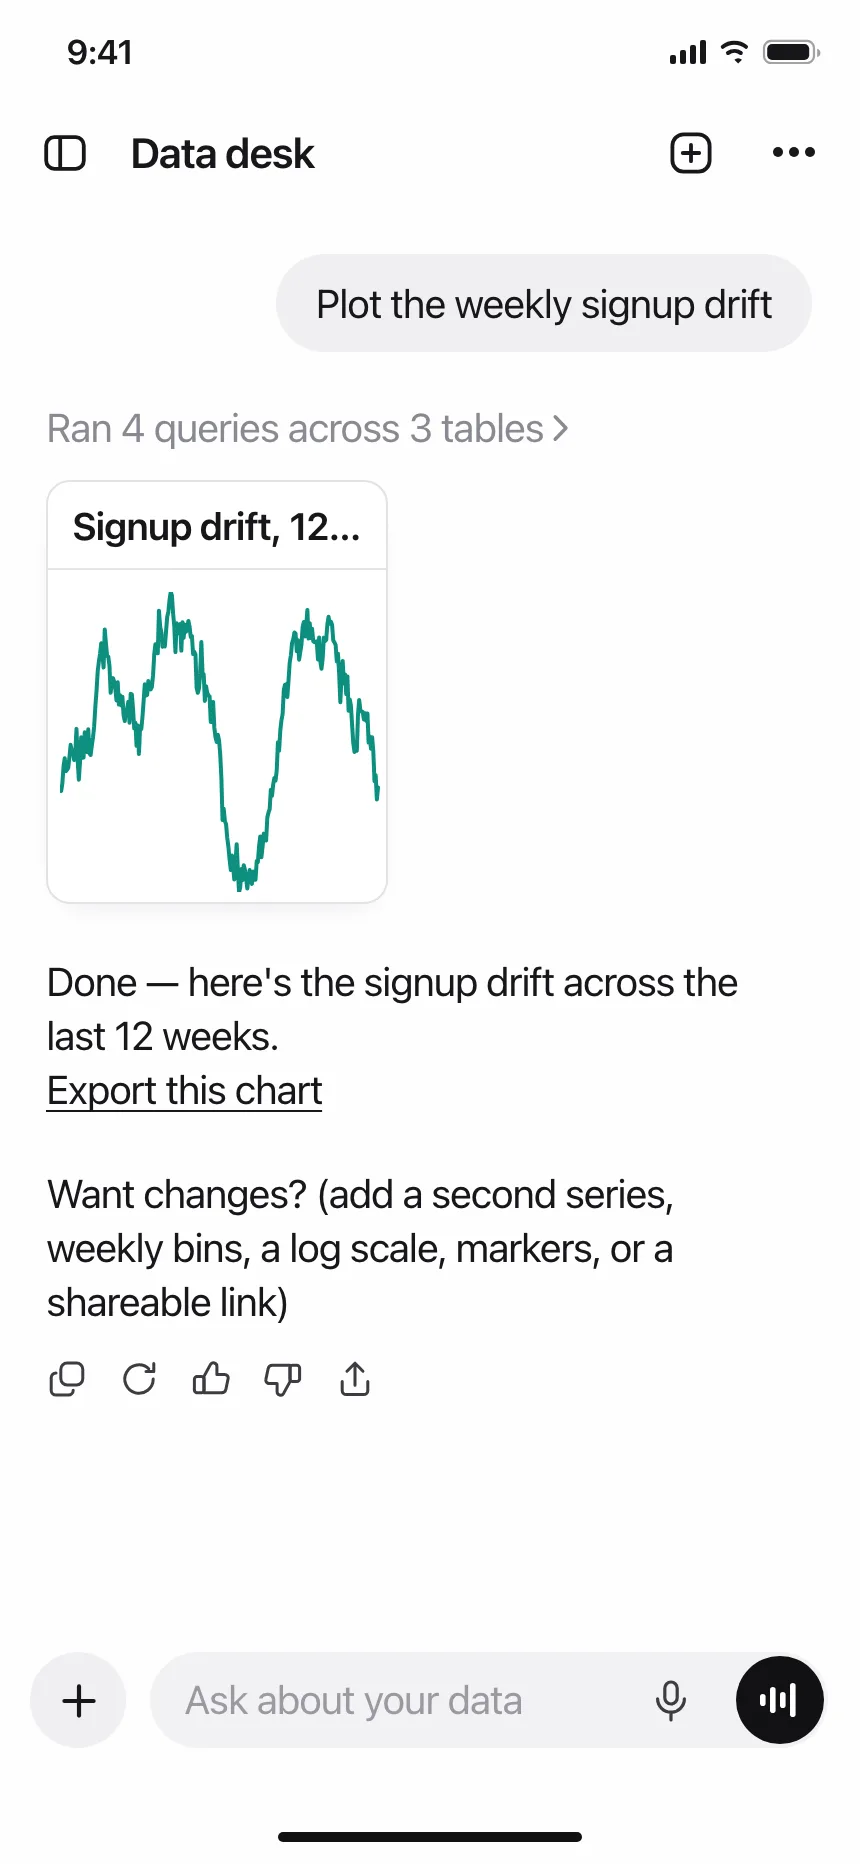
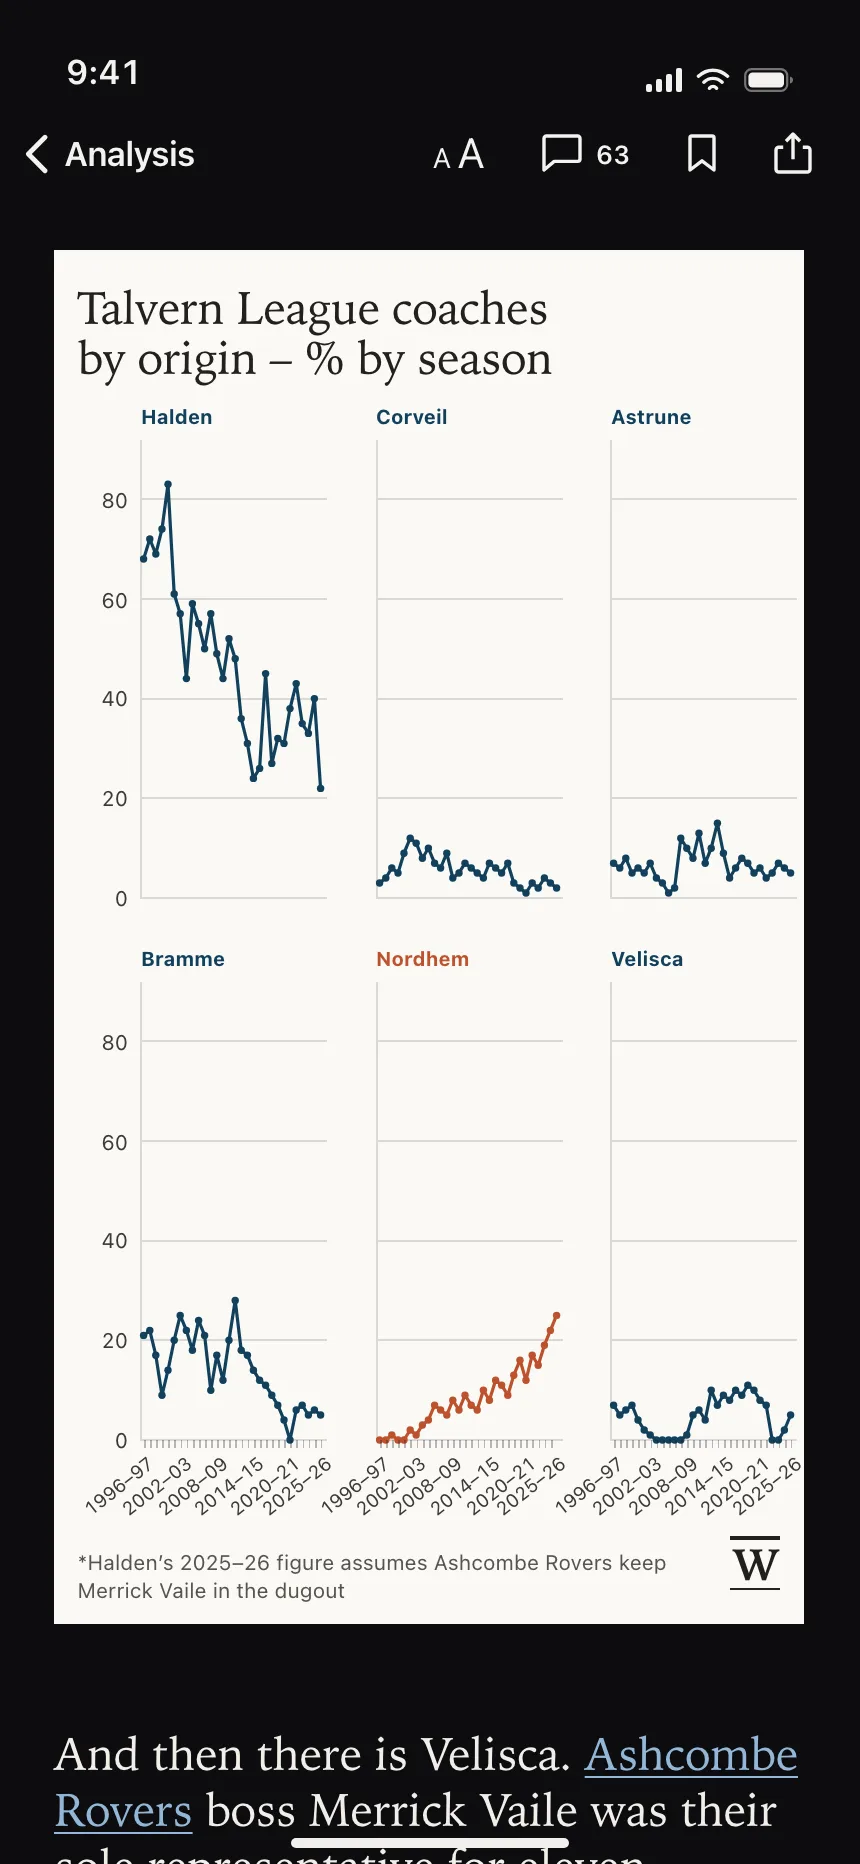
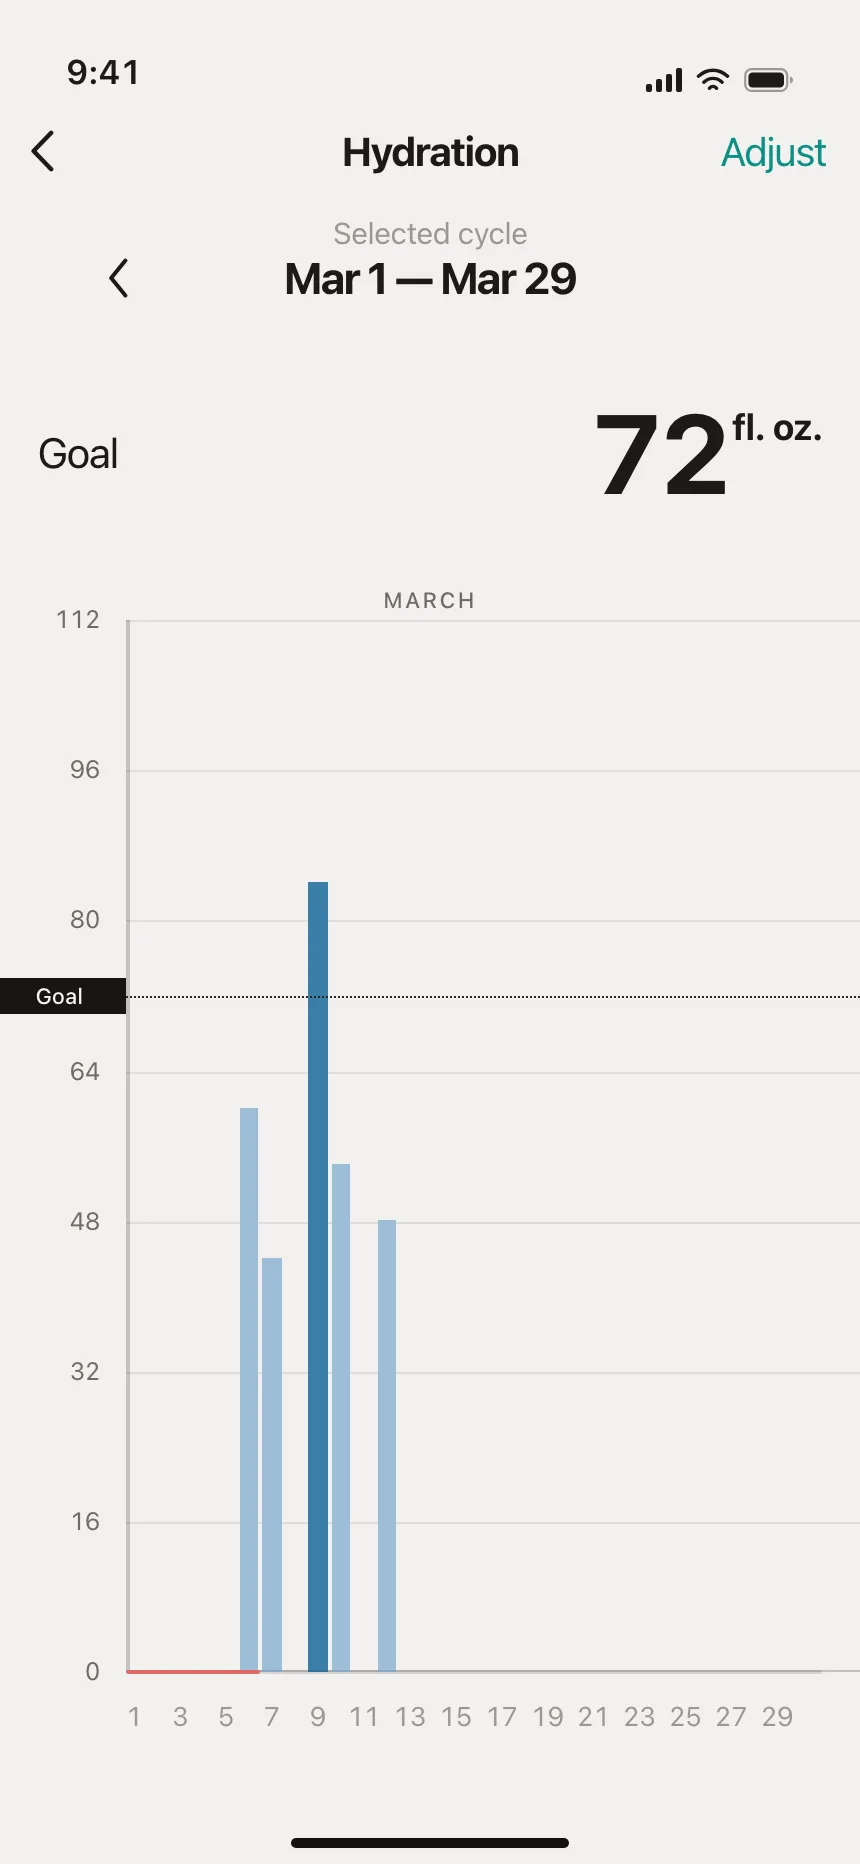
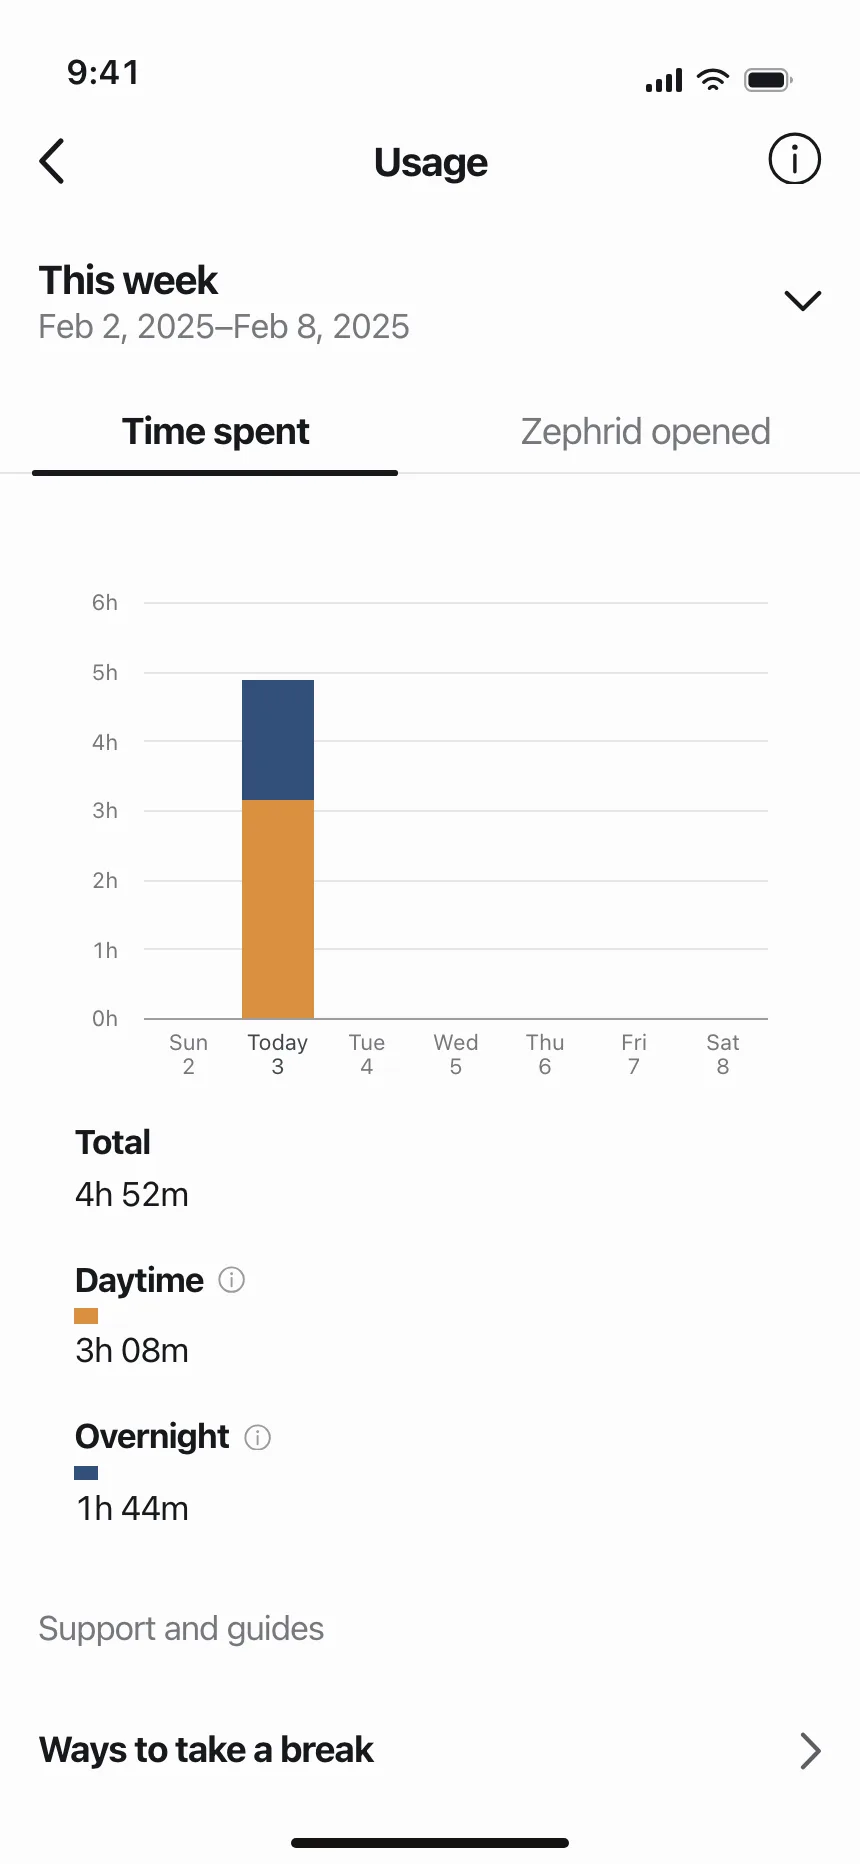
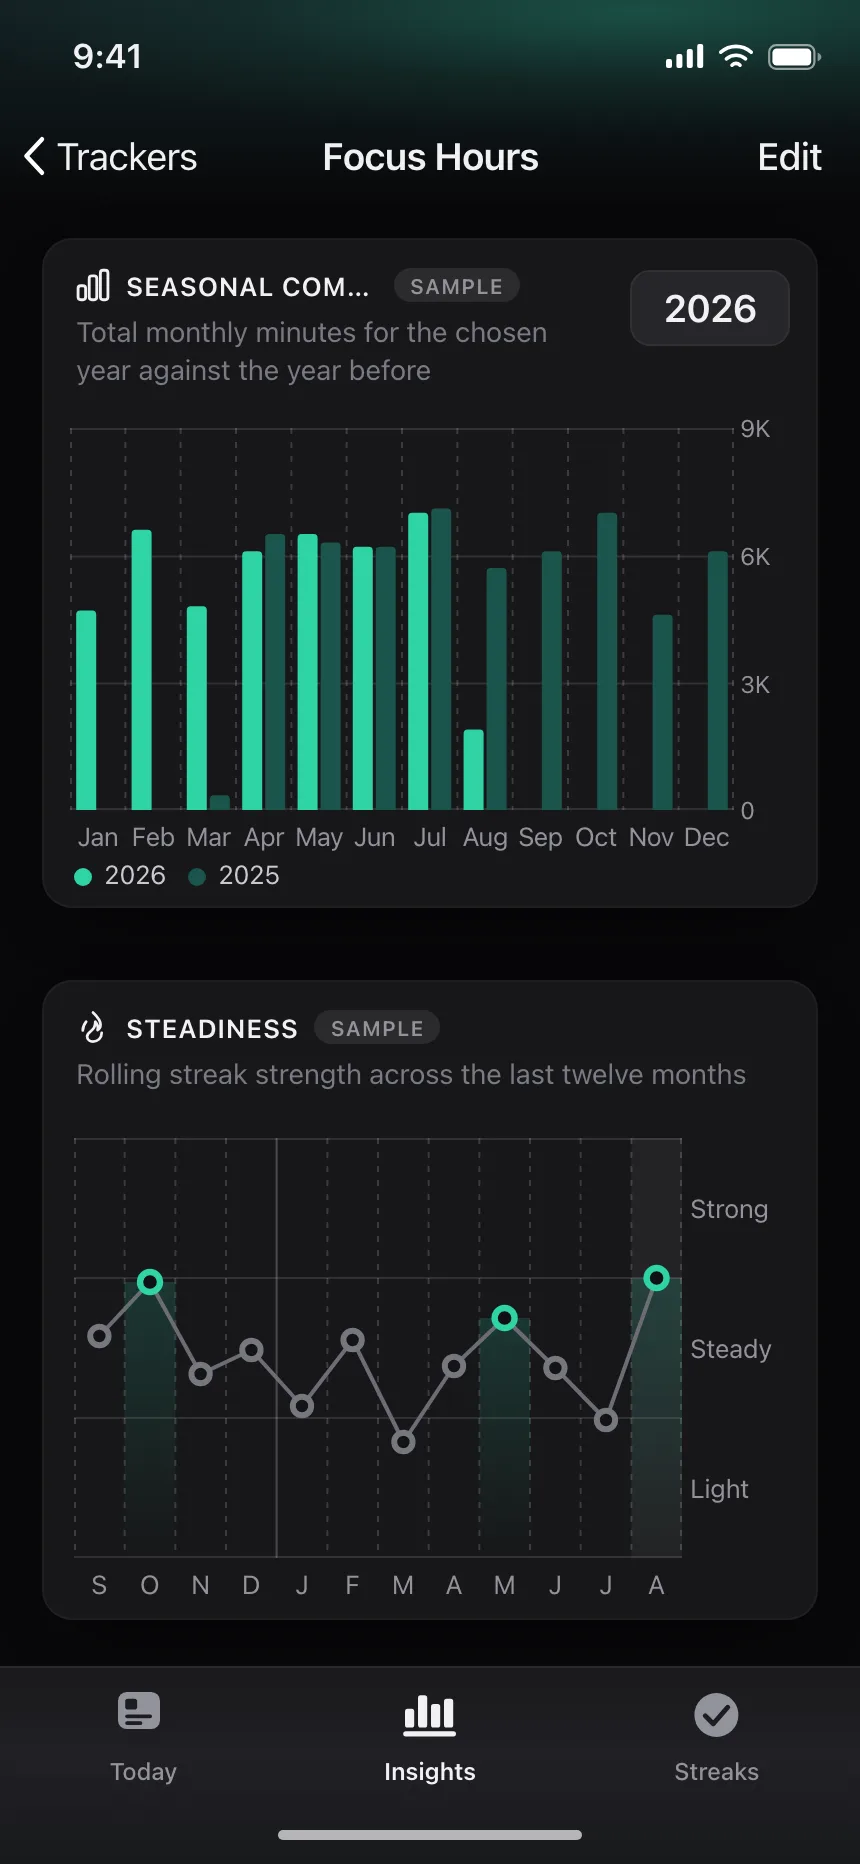
Data sheet in Tarnwick plotting queue depth drift against step count.
- Style
- light sheet on a deep navy-black backdrop, white plot area, grey axis text, raspberry accent.
- Layout
- a card sheet stacked over a second sheet edge, title row on top, plot below.